Fig. 4.
Download original image
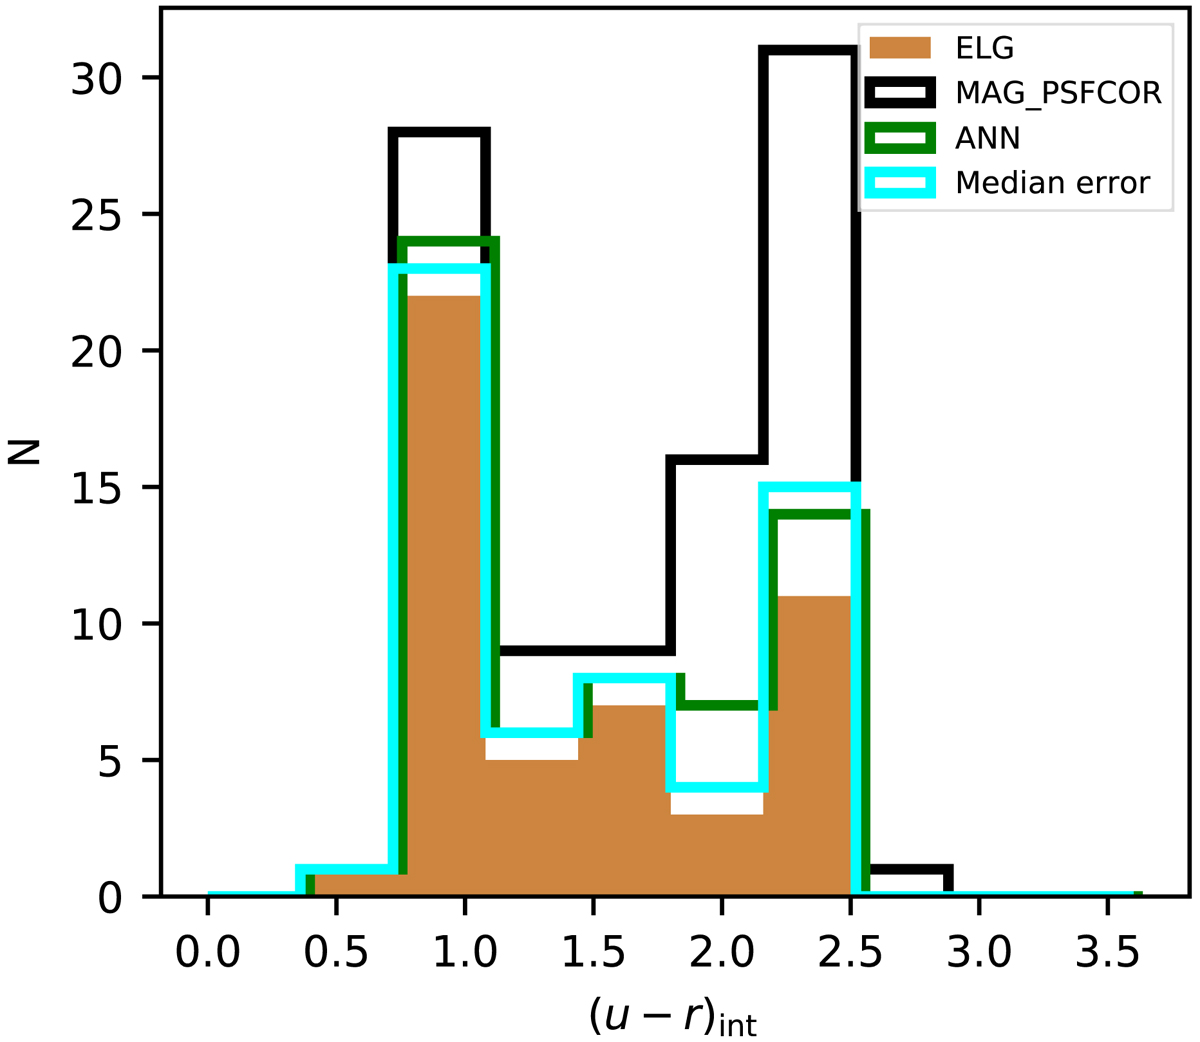
(u − r)int histogram comparing the emission line galaxies selection criteria. The black line shows the distribution of all the galaxies in the AMICO catalogue. Cyan histogram shows the distribution for the median error. Same for green but with the ANN method. Orange solid histogram shows the distribution for the common galaxies for both methods. The different distributions have been shifted a little bit in the plot to show more clearly the similarities and differences between them.
Current usage metrics show cumulative count of Article Views (full-text article views including HTML views, PDF and ePub downloads, according to the available data) and Abstracts Views on Vision4Press platform.
Data correspond to usage on the plateform after 2015. The current usage metrics is available 48-96 hours after online publication and is updated daily on week days.
Initial download of the metrics may take a while.