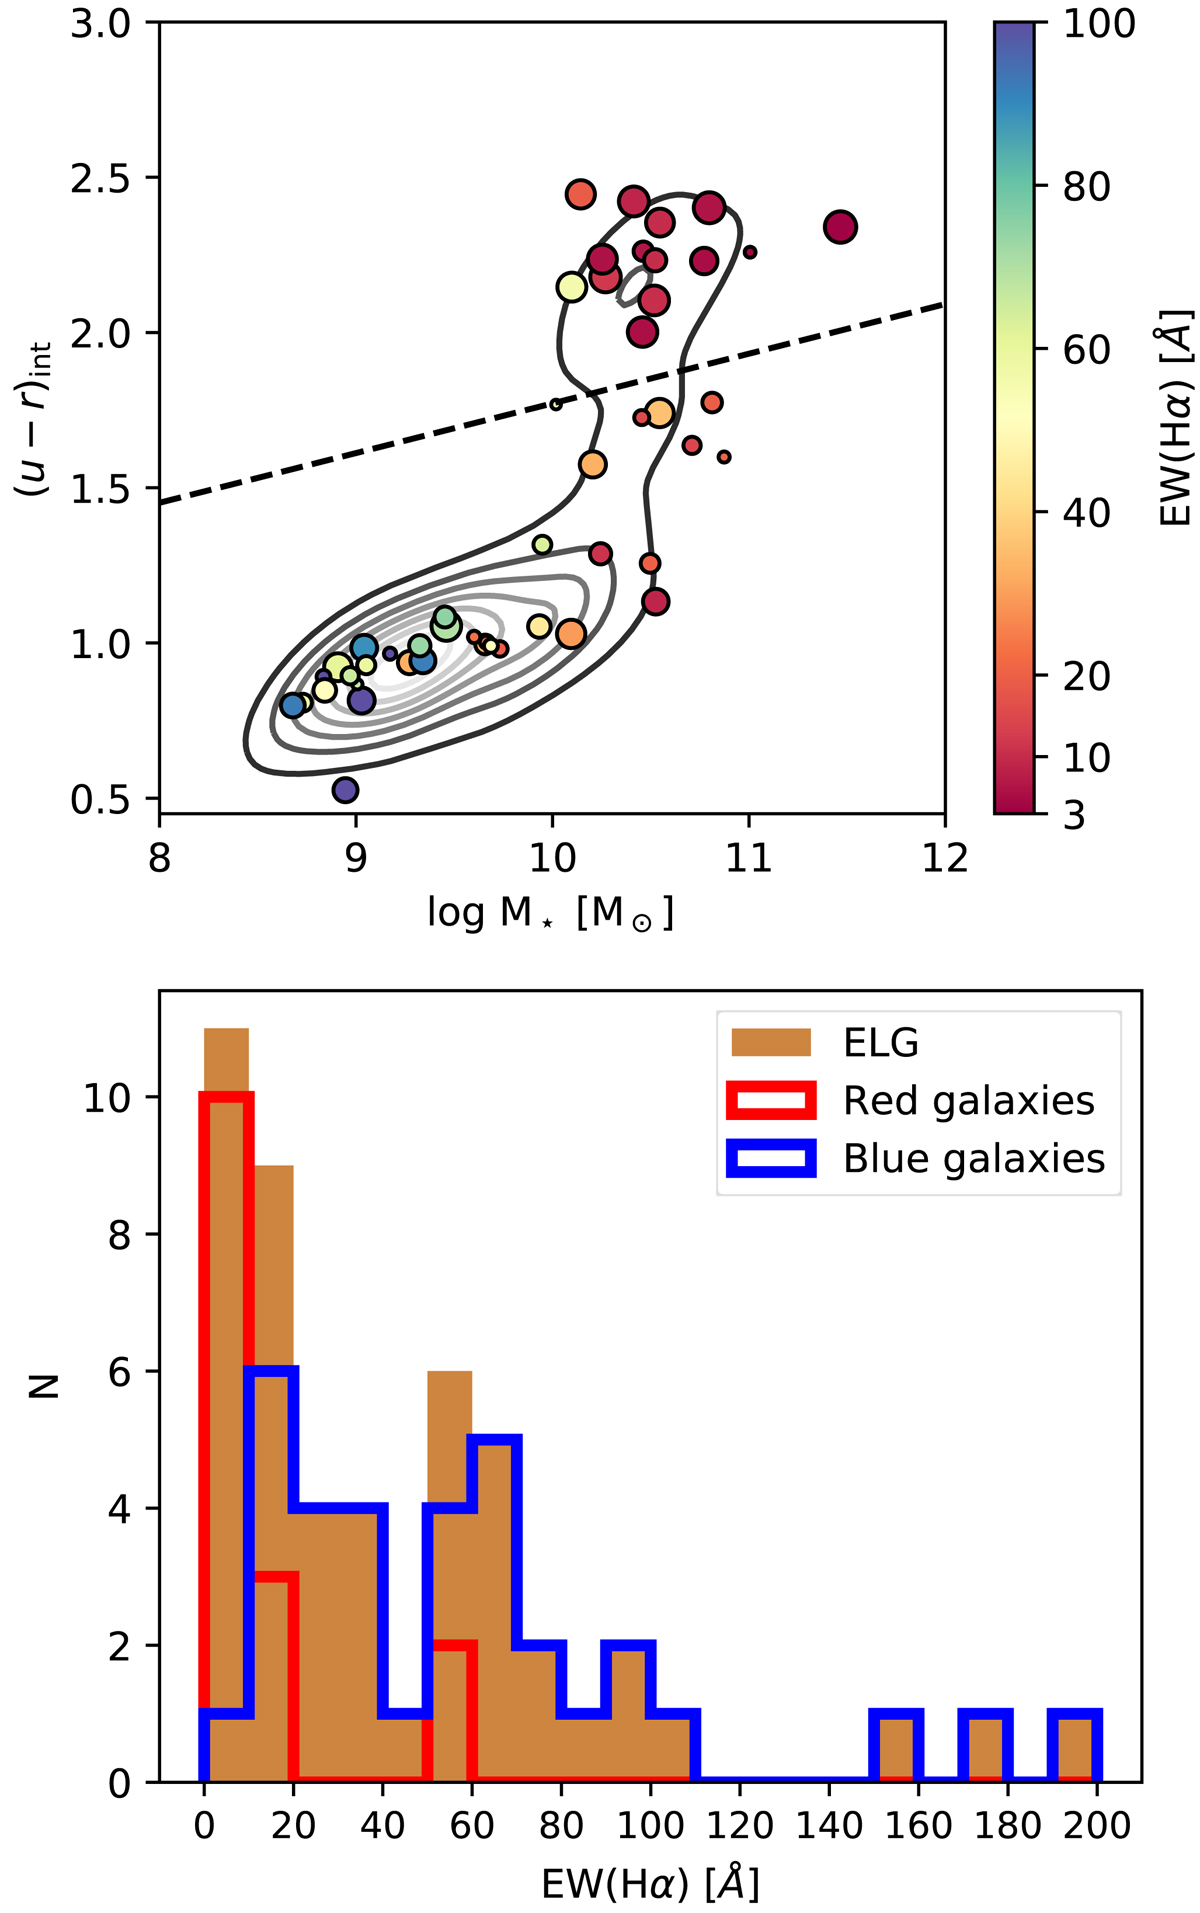
Fig. 7.
Download original image
EW(Hα) of the ELG population. Top panel: colour-mass diagram for the ELG galaxy population. The colour bar shows the Hα equivalent width. Galaxies above the black dashed line are considered to be red. Galaxies below are considered to be blue. Bottom panel: Hα equivalent width distribution histogram. Green histogram shows the distribution of the galaxies selected with the ANN method. Orange solid histogram shows the distribution for the selected galaxies. Red histogram shows the distribution of the selected red galaxies. The same holds true for blue histogram and blue galaxies.
Current usage metrics show cumulative count of Article Views (full-text article views including HTML views, PDF and ePub downloads, according to the available data) and Abstracts Views on Vision4Press platform.
Data correspond to usage on the plateform after 2015. The current usage metrics is available 48-96 hours after online publication and is updated daily on week days.
Initial download of the metrics may take a while.