Fig. 8.
Download original image
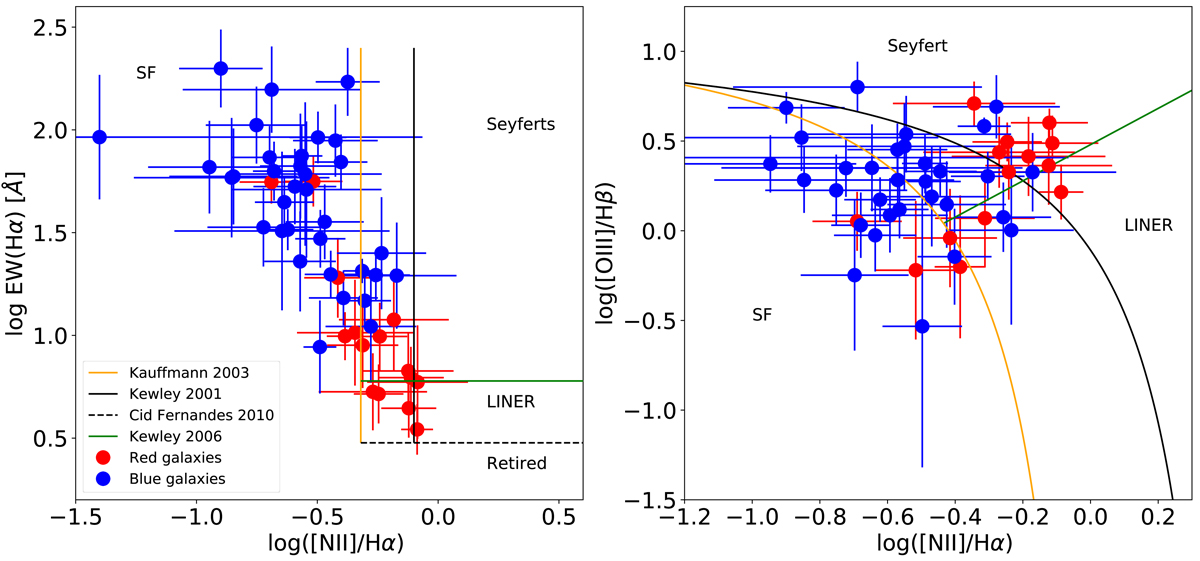
ELG classification diagrams. Left panel: WHAN diagram with the galaxies classified as emission line galaxies. Red points represent red galaxies and blue points, blue galaxies. The solid orange and black lines represent the Cid Fernandes et al. (2010) transposition of the Kauffmann et al. (2003a) and Kewley et al. (2001) SF-AGN distiction criteria, and the green solid line represents the transposition of the Kewley et al. (2006) made by Cid Fernandes et al. (2010). The dashed black line represents the distinction between retired galaxies and LINERs (Cid Fernandes et al. 2011). Right panel: BPT diagram for the emission line galaxy population. The colour coding is the same as the left panel.
Current usage metrics show cumulative count of Article Views (full-text article views including HTML views, PDF and ePub downloads, according to the available data) and Abstracts Views on Vision4Press platform.
Data correspond to usage on the plateform after 2015. The current usage metrics is available 48-96 hours after online publication and is updated daily on week days.
Initial download of the metrics may take a while.