Open Access
Fig. 9.
Download original image
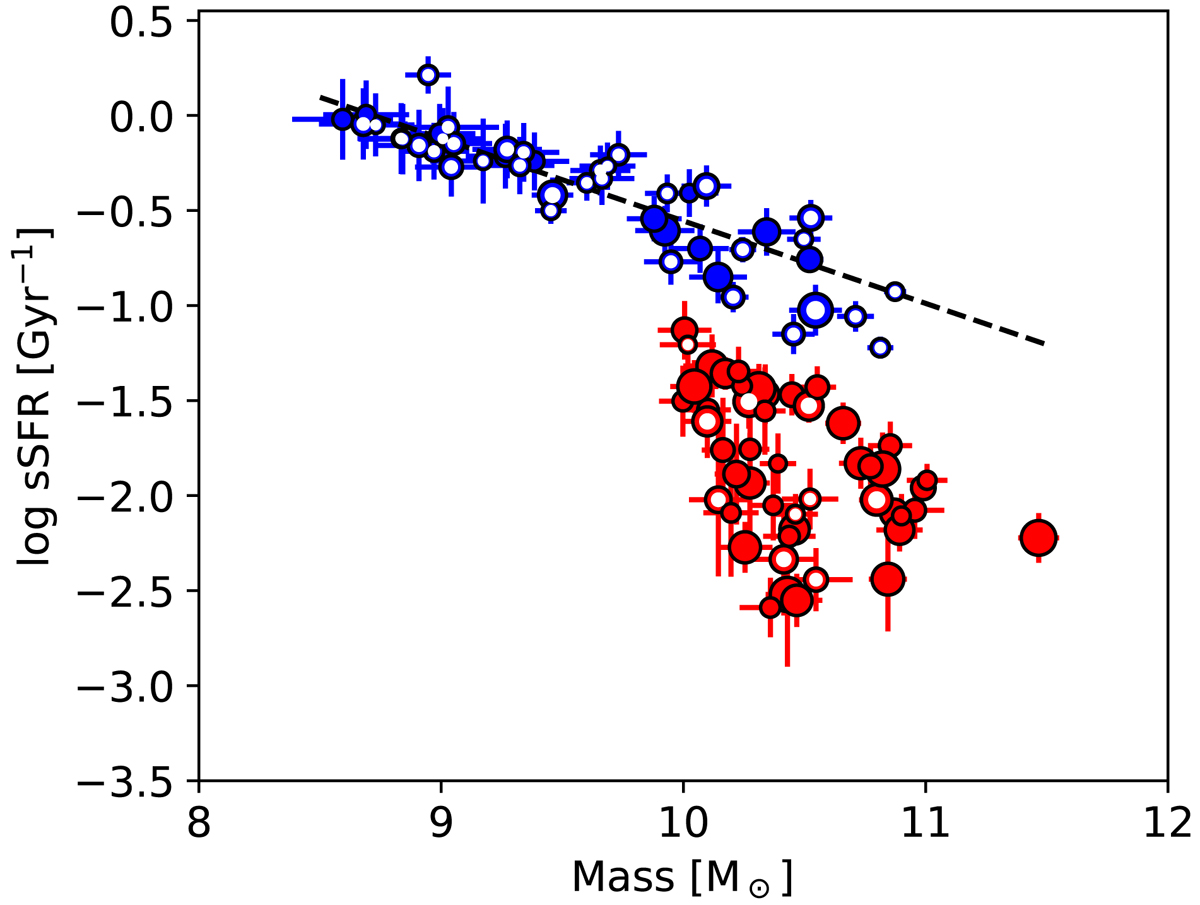
Star formation main sequence. Red dots represent the red galaxies. Blue dots represent blue galaxies. White dots represent the ELG population (selected in Sect. 3.3) with inferred EW(Hα) > 6 Å. Dot size is proportional to the inverse distance to the BCG.
Current usage metrics show cumulative count of Article Views (full-text article views including HTML views, PDF and ePub downloads, according to the available data) and Abstracts Views on Vision4Press platform.
Data correspond to usage on the plateform after 2015. The current usage metrics is available 48-96 hours after online publication and is updated daily on week days.
Initial download of the metrics may take a while.