Fig. 4
Download original image
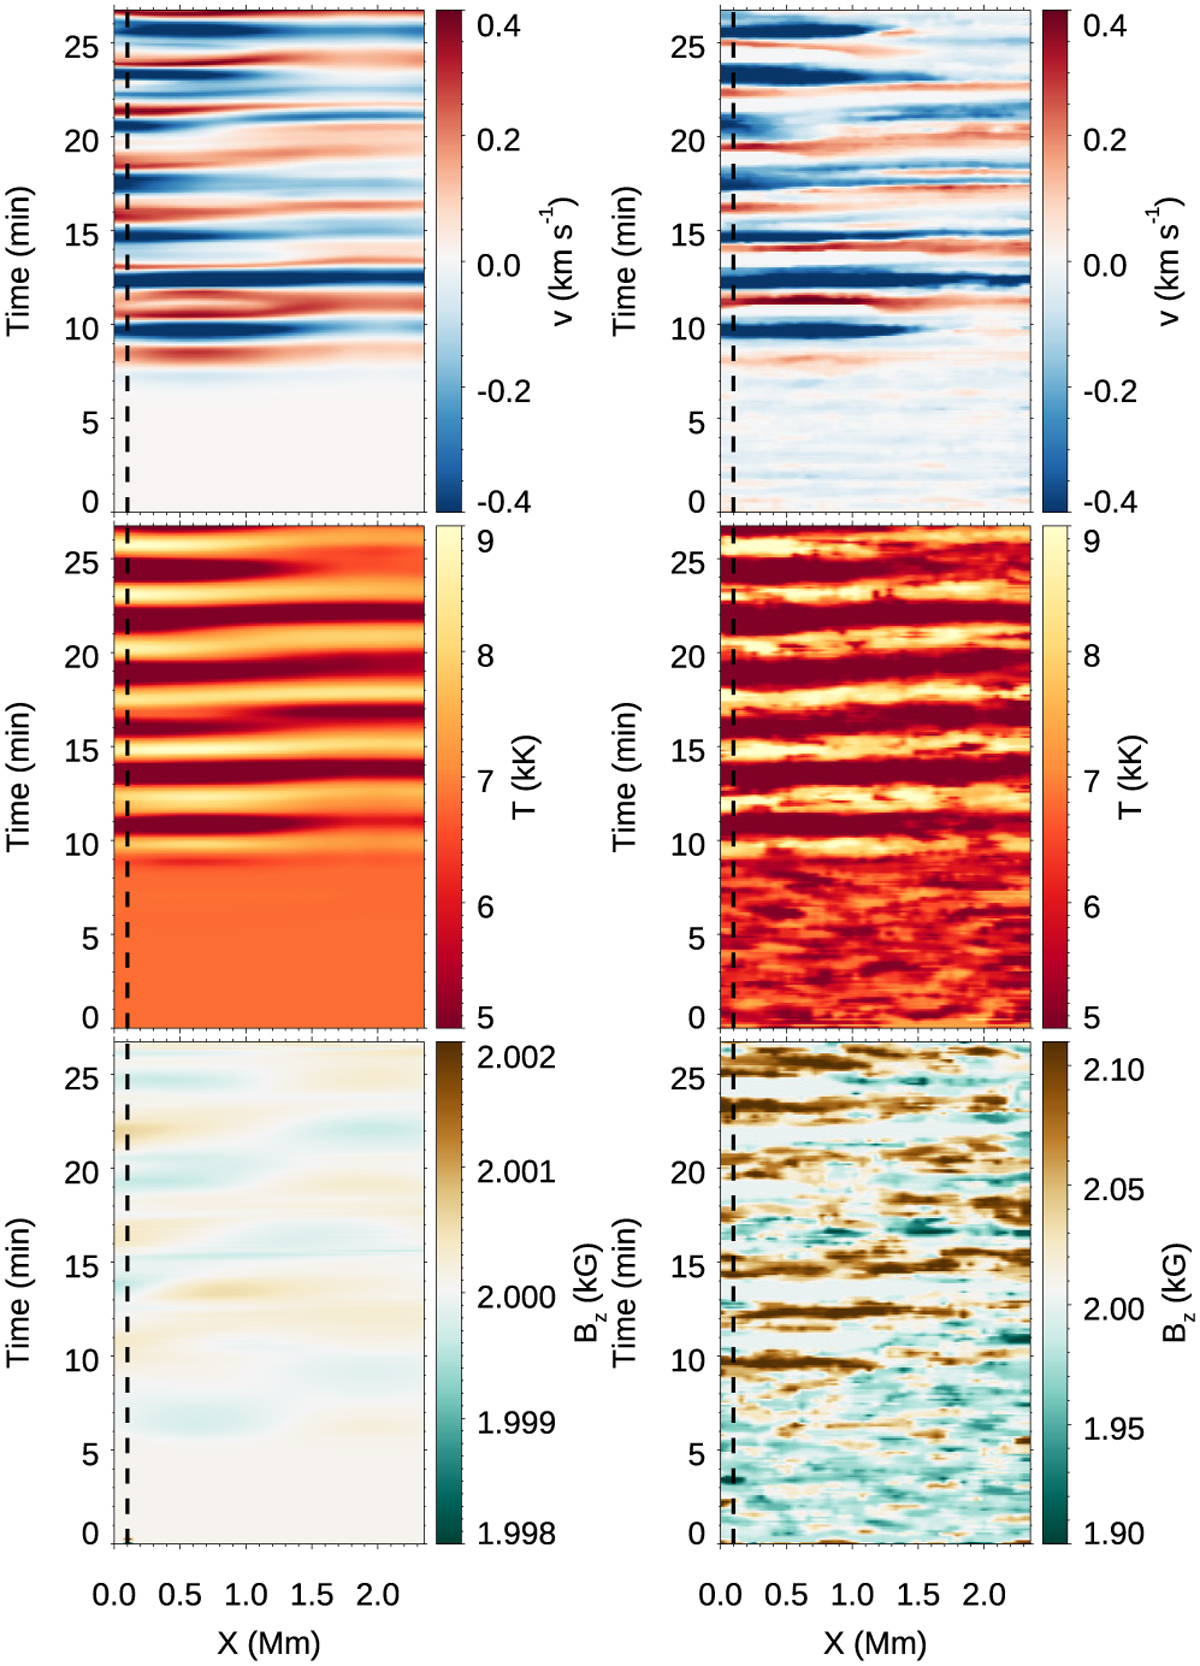
Simulations of wave propagation in a sunspot umbra by Felipe et al. (2021a). Left panels: time-distance maps of variations in the vertical velocity (top), temperature (middle), and the vertical magnetic field component (bottom) in the chromosphere. Right panels: same quantities obtained after NICOLE inversions of the Ca II 854.2 nm line synthesised from the simulations. From Felipe et al. (2021b).
Current usage metrics show cumulative count of Article Views (full-text article views including HTML views, PDF and ePub downloads, according to the available data) and Abstracts Views on Vision4Press platform.
Data correspond to usage on the plateform after 2015. The current usage metrics is available 48-96 hours after online publication and is updated daily on week days.
Initial download of the metrics may take a while.