Fig. 5
Download original image
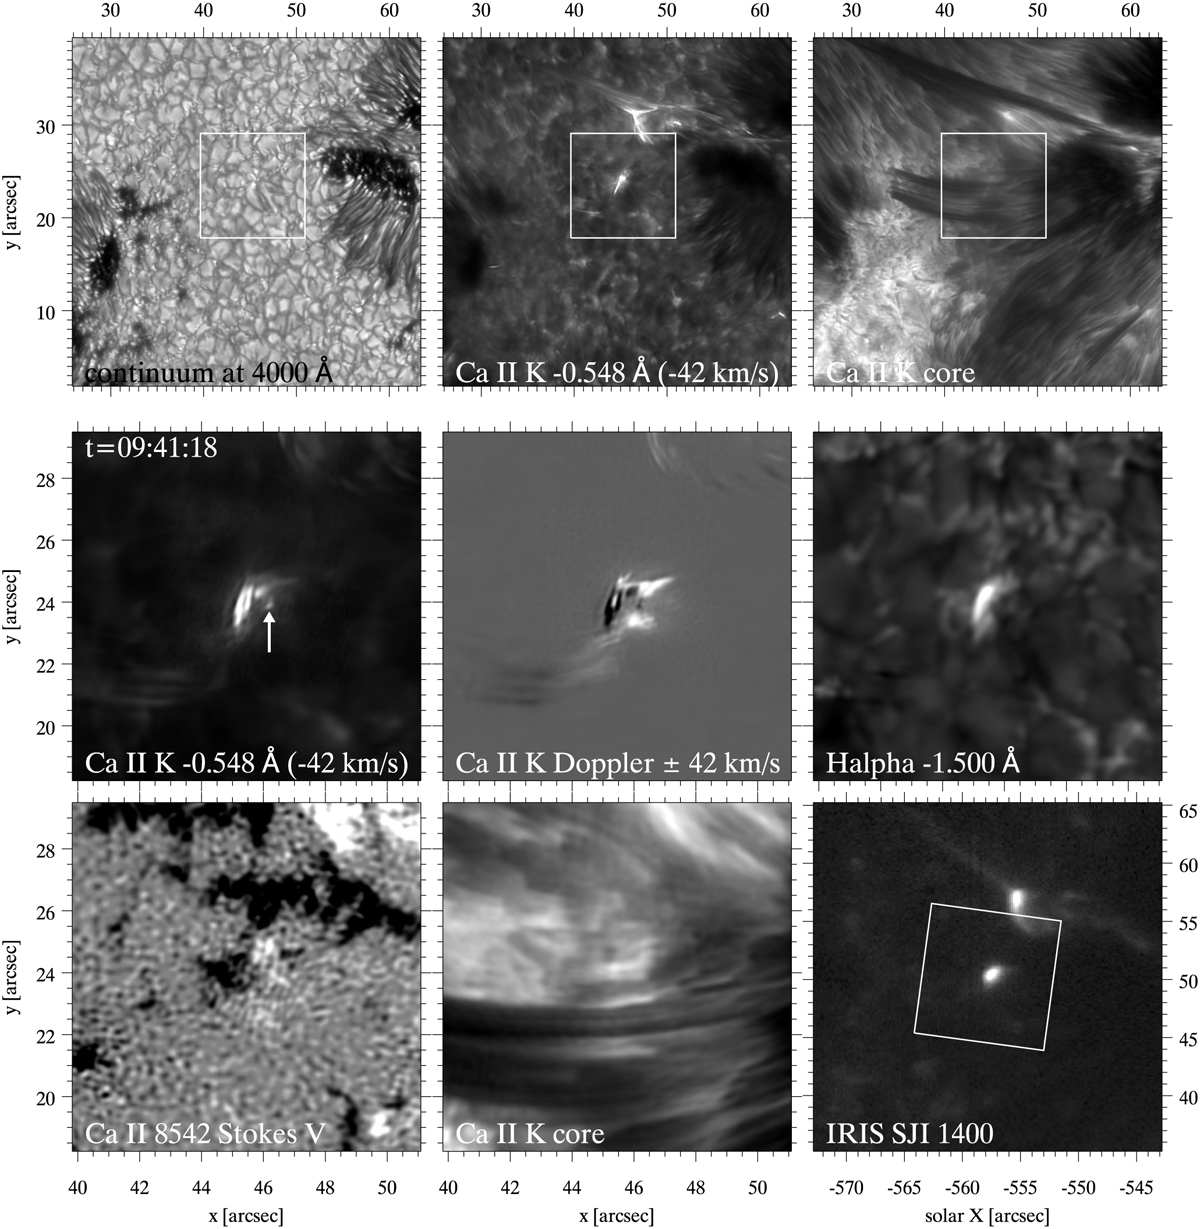
Example of a plasmoid instability. Panels correspond to SST observations, except the bottom right panel, which displays the IRIS slit-jaw image (SJI) sampled using the 140 nm filter. The white box in the top row and the IRIS SJI 140 nm image marks the area centred on the UV burst, which is shown in more detail in the SST images in the two bottom rows. The white arrow marks an isolated plasmoid-like blob. From Rouppe van der Voort et al. (2017).
Current usage metrics show cumulative count of Article Views (full-text article views including HTML views, PDF and ePub downloads, according to the available data) and Abstracts Views on Vision4Press platform.
Data correspond to usage on the plateform after 2015. The current usage metrics is available 48-96 hours after online publication and is updated daily on week days.
Initial download of the metrics may take a while.