Fig. 7
Download original image
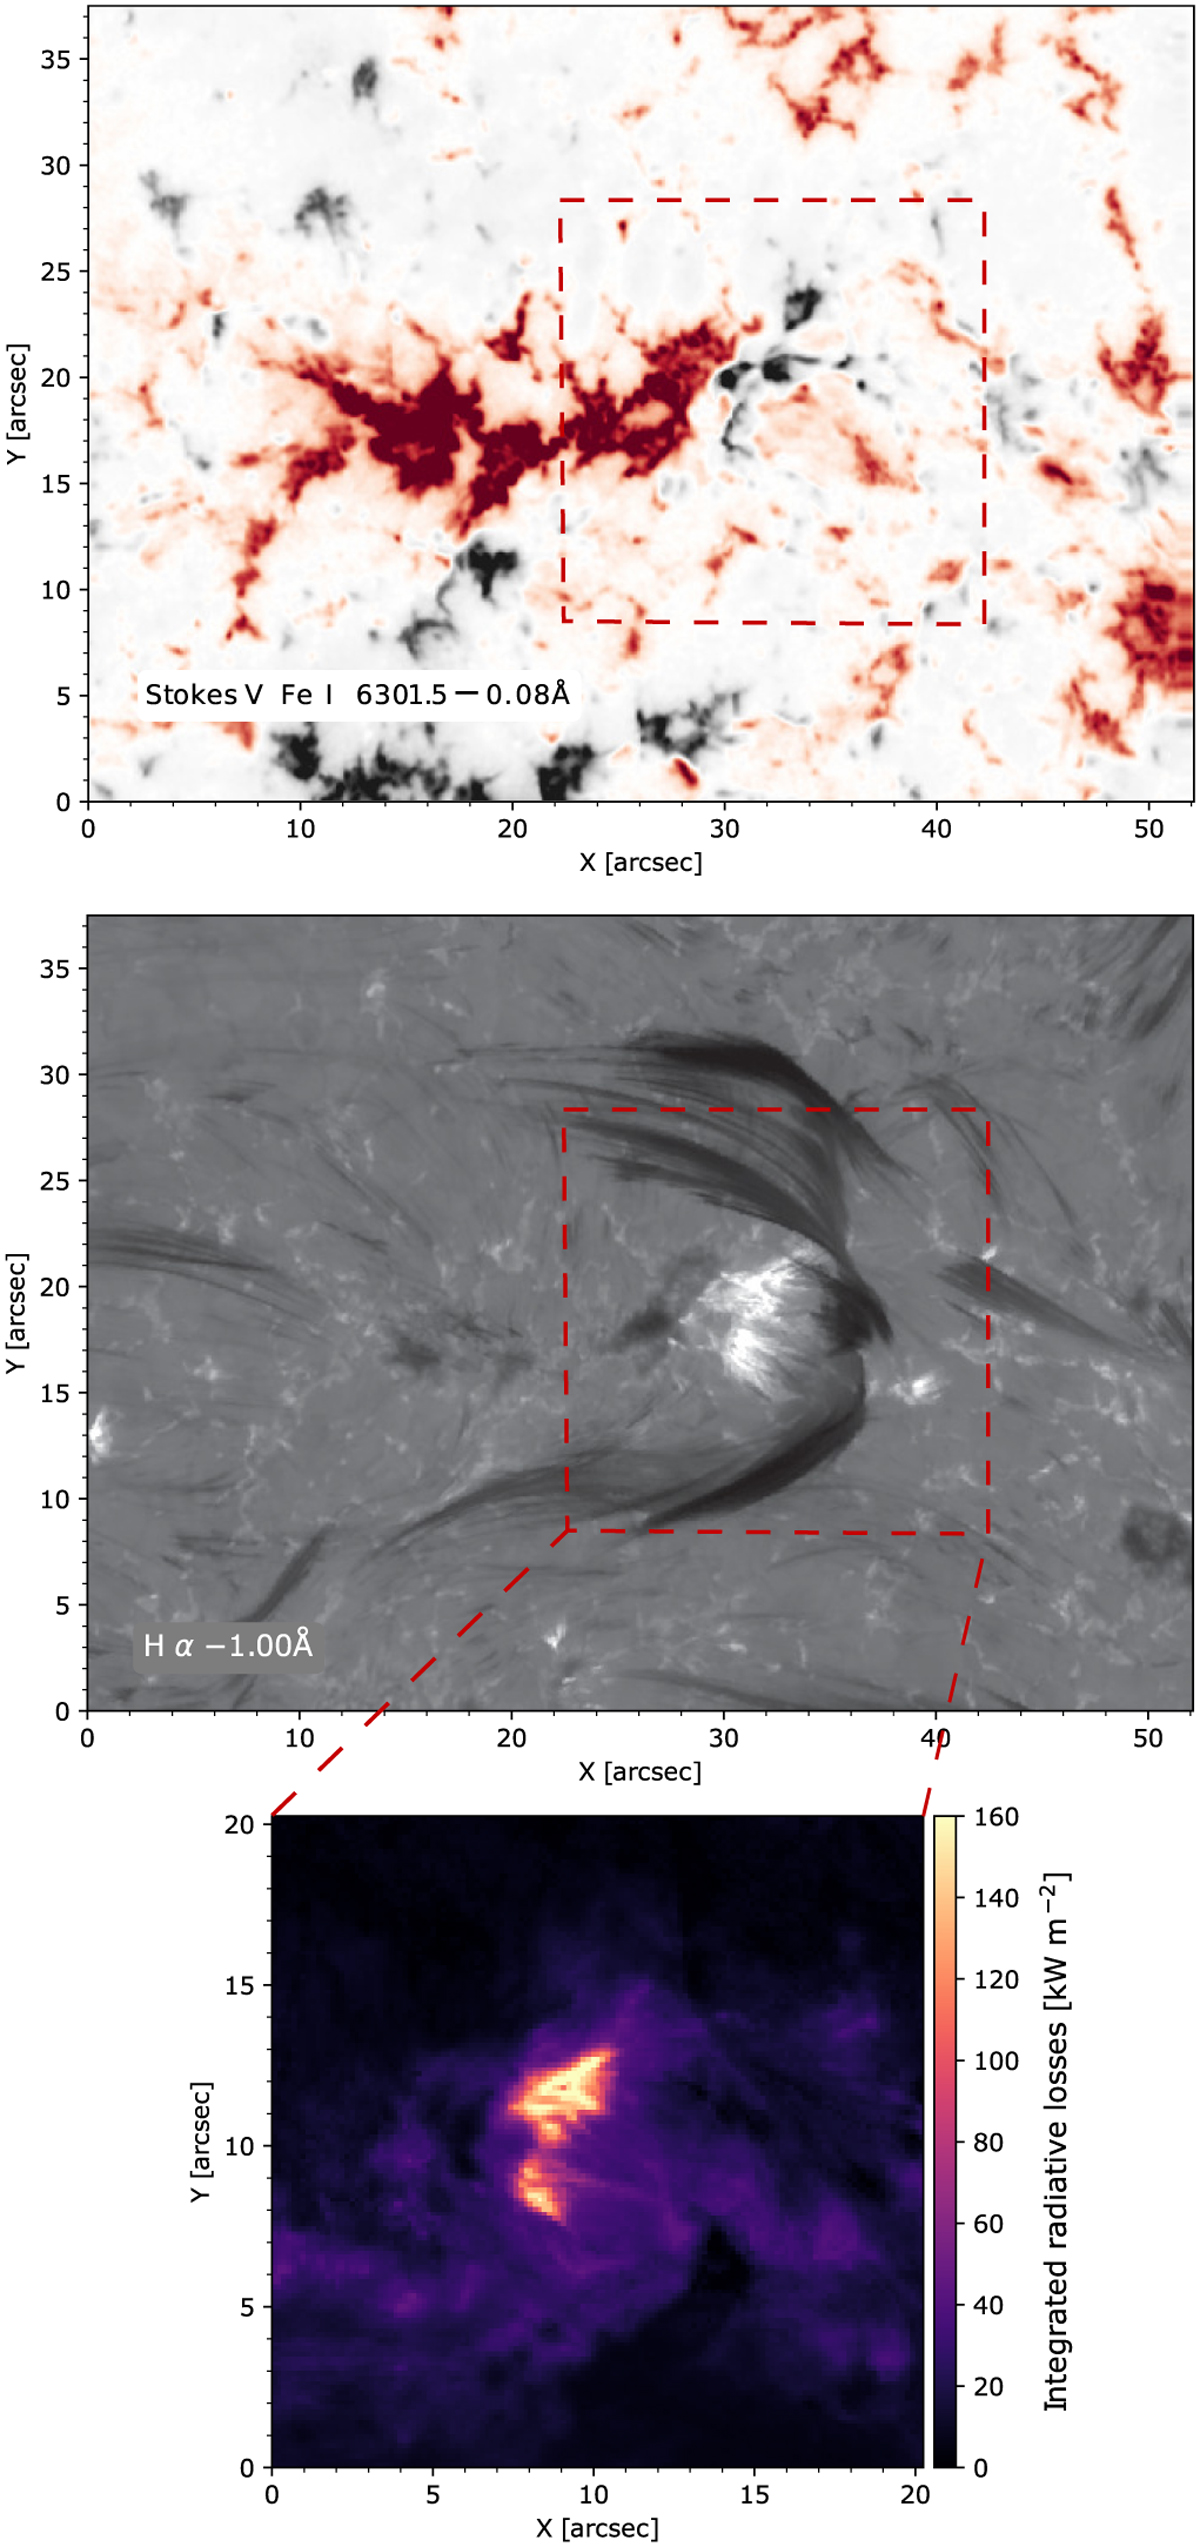
Spatially resolved net radiative losses in the chromosphere of an emerging-flux region (bottom), a context Ha image (middle), and the line-of-sight component of the photospheric magnetic field (top). The red box indicates the FOV used to calculate the radiative losses. The observations were acquired at the SST in the Ca II K line, Ca II 854 nm, Fe I 630.1, and 630.2 nm and in the Ha line with the CRISP and CHROMIS instruments. Adapted from Díaz Baso et al. (2021).
Current usage metrics show cumulative count of Article Views (full-text article views including HTML views, PDF and ePub downloads, according to the available data) and Abstracts Views on Vision4Press platform.
Data correspond to usage on the plateform after 2015. The current usage metrics is available 48-96 hours after online publication and is updated daily on week days.
Initial download of the metrics may take a while.