Fig. 8
Download original image
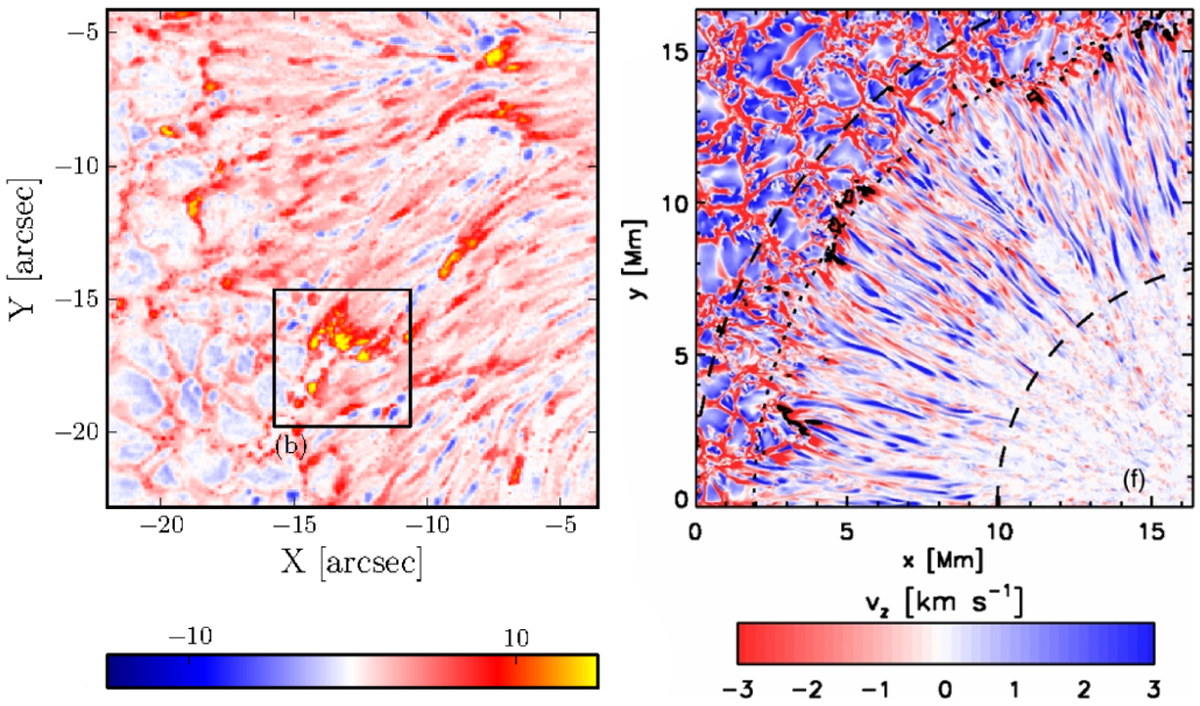
Observations in comparison with simulations. Left panel: line-of-sight velocity determined with inversions of Hinode spectropolarimetric observations (adapted from van Noort et al. 2013), and the right panel displays the line-of-sight velocity resulting from an MHD simulation of a sunspot with a grid size of 16 km (adapted from Rempel 2012). Both panels display the spatial distribution of the velocity at the optical depth unity at continuum wavelengths.
Current usage metrics show cumulative count of Article Views (full-text article views including HTML views, PDF and ePub downloads, according to the available data) and Abstracts Views on Vision4Press platform.
Data correspond to usage on the plateform after 2015. The current usage metrics is available 48-96 hours after online publication and is updated daily on week days.
Initial download of the metrics may take a while.