Fig. 9
Download original image
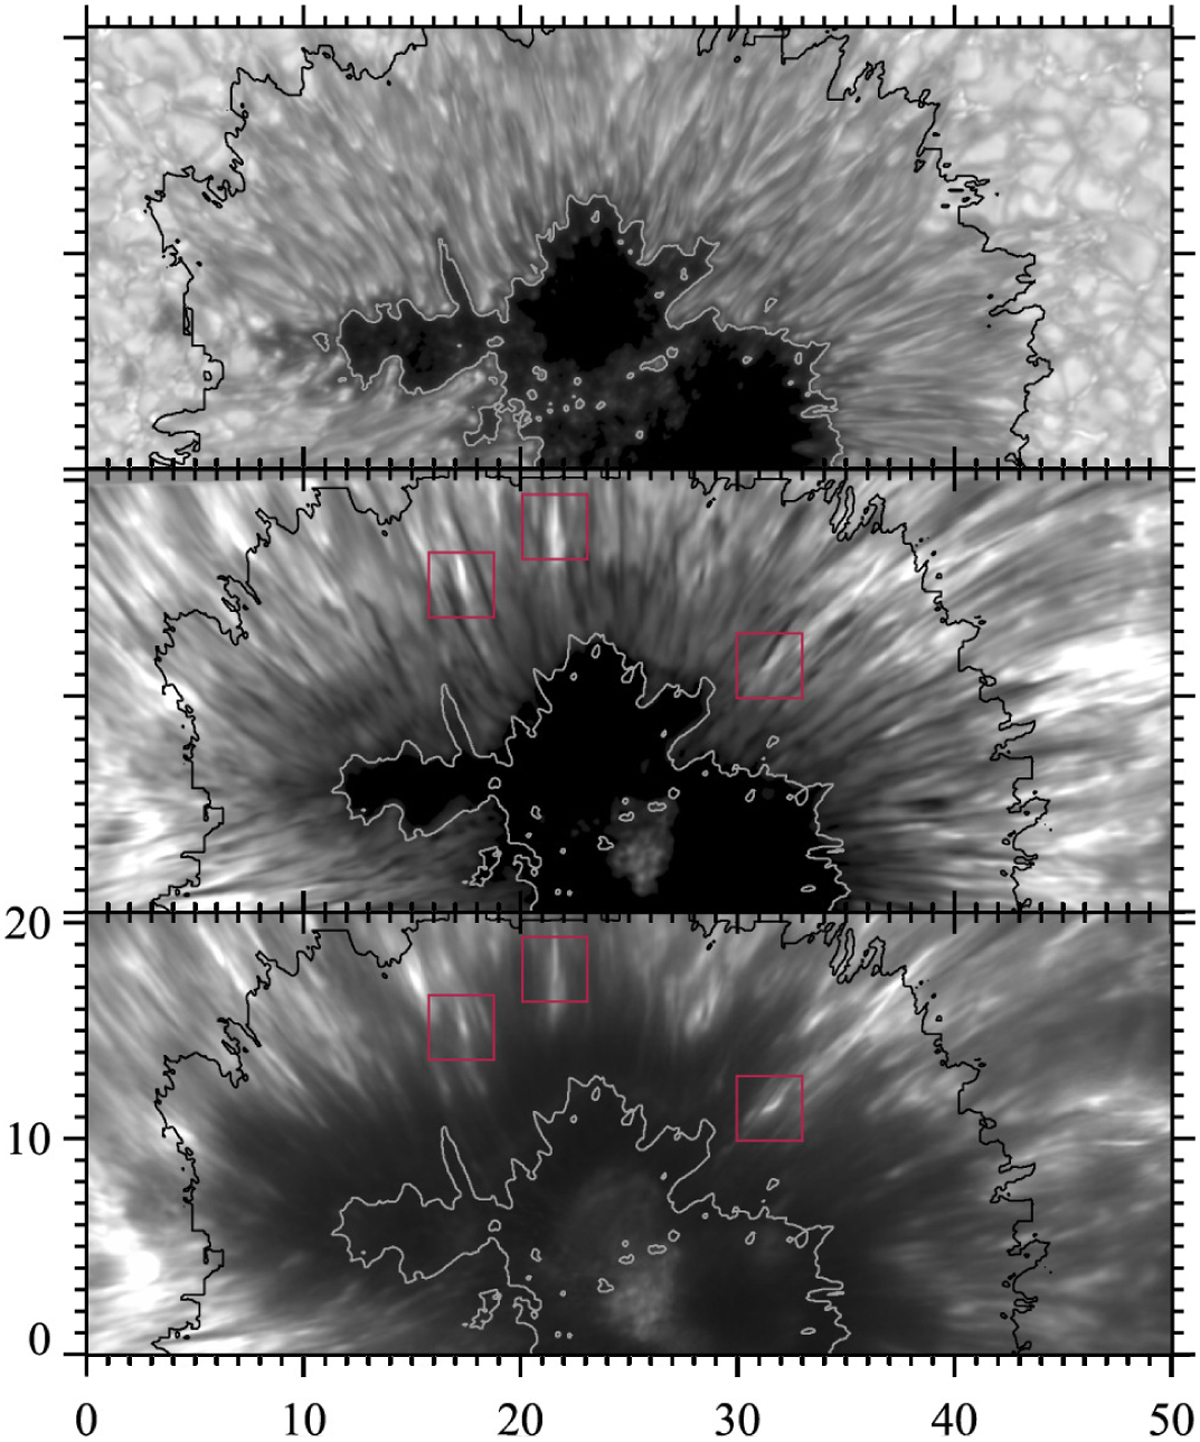
Filtergram images of the continuum around the Fe I 630.1 nm line (top), the blue wing of the Ca II 854.2 nm line at −0.021 nm (middle), and the blue wing of the Ca II K line at −0.024 nm (bottom). Pink squares show the position of penumbral microjets in the middle and bottom panels. Axes are in arcseconds. Contours outline the inner and outer boundaries of the penumbra. Adapted from Esteban Pozuelo et al. (2019).
Current usage metrics show cumulative count of Article Views (full-text article views including HTML views, PDF and ePub downloads, according to the available data) and Abstracts Views on Vision4Press platform.
Data correspond to usage on the plateform after 2015. The current usage metrics is available 48-96 hours after online publication and is updated daily on week days.
Initial download of the metrics may take a while.