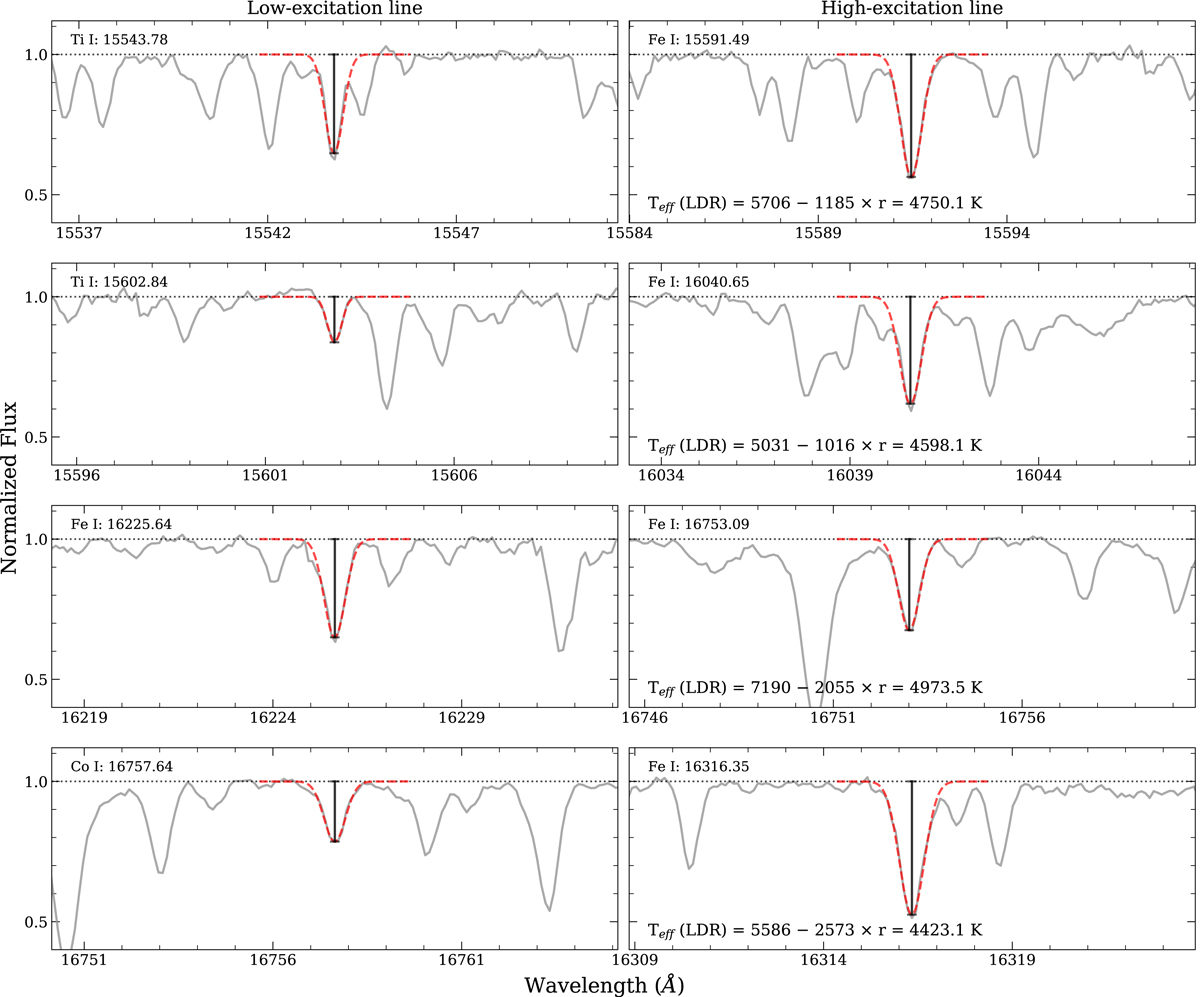
Fig. 2.
Download original image
Examples of low-excitation and high-excitation line pairs used for the LDR method for C1103-10405 (Teff = 4680 K). The gray line is the observed spectrum, and the dashed red line is a Gaussian fit. We measured the line depth as the maximum height of the fitted line measured from the continuum. The LDR (r) is estimated as the ratio of the line depths of low- and high-excitation lines. The relations between Teff and r for each pair of Fukue et al. (2015) are listed in the right panels.
Current usage metrics show cumulative count of Article Views (full-text article views including HTML views, PDF and ePub downloads, according to the available data) and Abstracts Views on Vision4Press platform.
Data correspond to usage on the plateform after 2015. The current usage metrics is available 48-96 hours after online publication and is updated daily on week days.
Initial download of the metrics may take a while.