Fig. 9.
Download original image
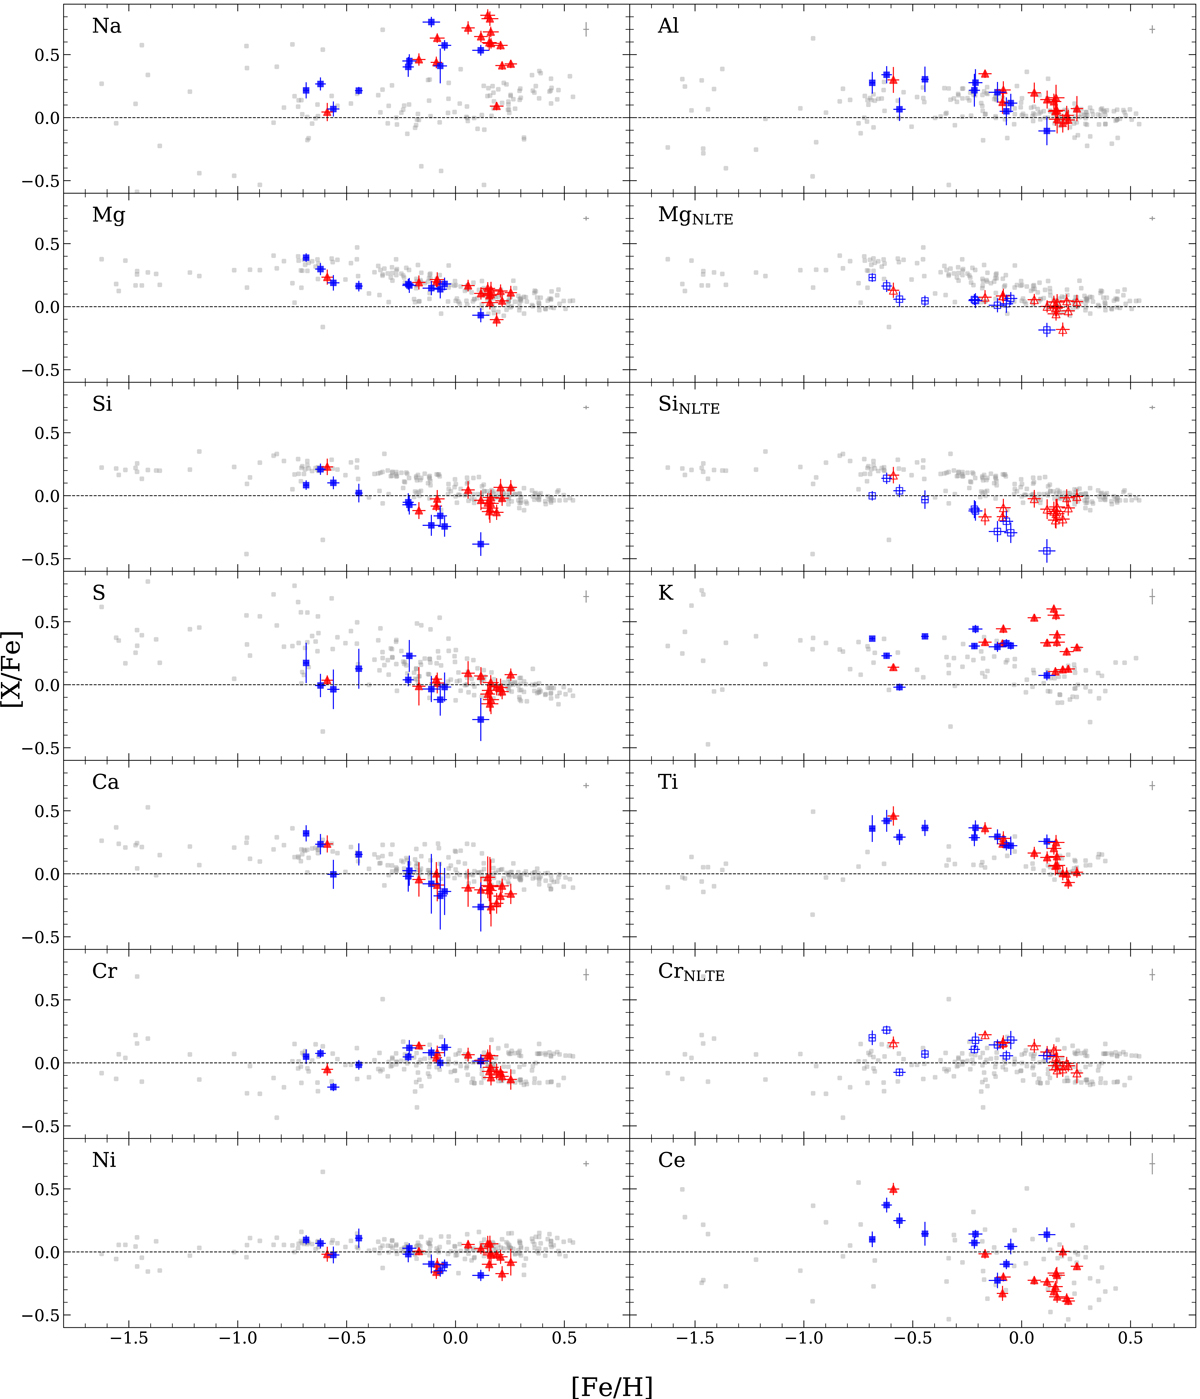
Chemical abundance ratios of our target stars, together with nearby APOGEE stars (d < 15′). The symbols are the same as in Fig. 1, and open symbols show abundance ratios after NLTE correction. The vertical and horizontal bars for each marker indicate the measurement error for each element, which is taken as σ/![]() from Tables 5 and 6. The gray cross in the upper right corner of each panel indicates the typical measurement error of the APOGEE samples.
from Tables 5 and 6. The gray cross in the upper right corner of each panel indicates the typical measurement error of the APOGEE samples.
Current usage metrics show cumulative count of Article Views (full-text article views including HTML views, PDF and ePub downloads, according to the available data) and Abstracts Views on Vision4Press platform.
Data correspond to usage on the plateform after 2015. The current usage metrics is available 48-96 hours after online publication and is updated daily on week days.
Initial download of the metrics may take a while.