Fig. 3
Download original image
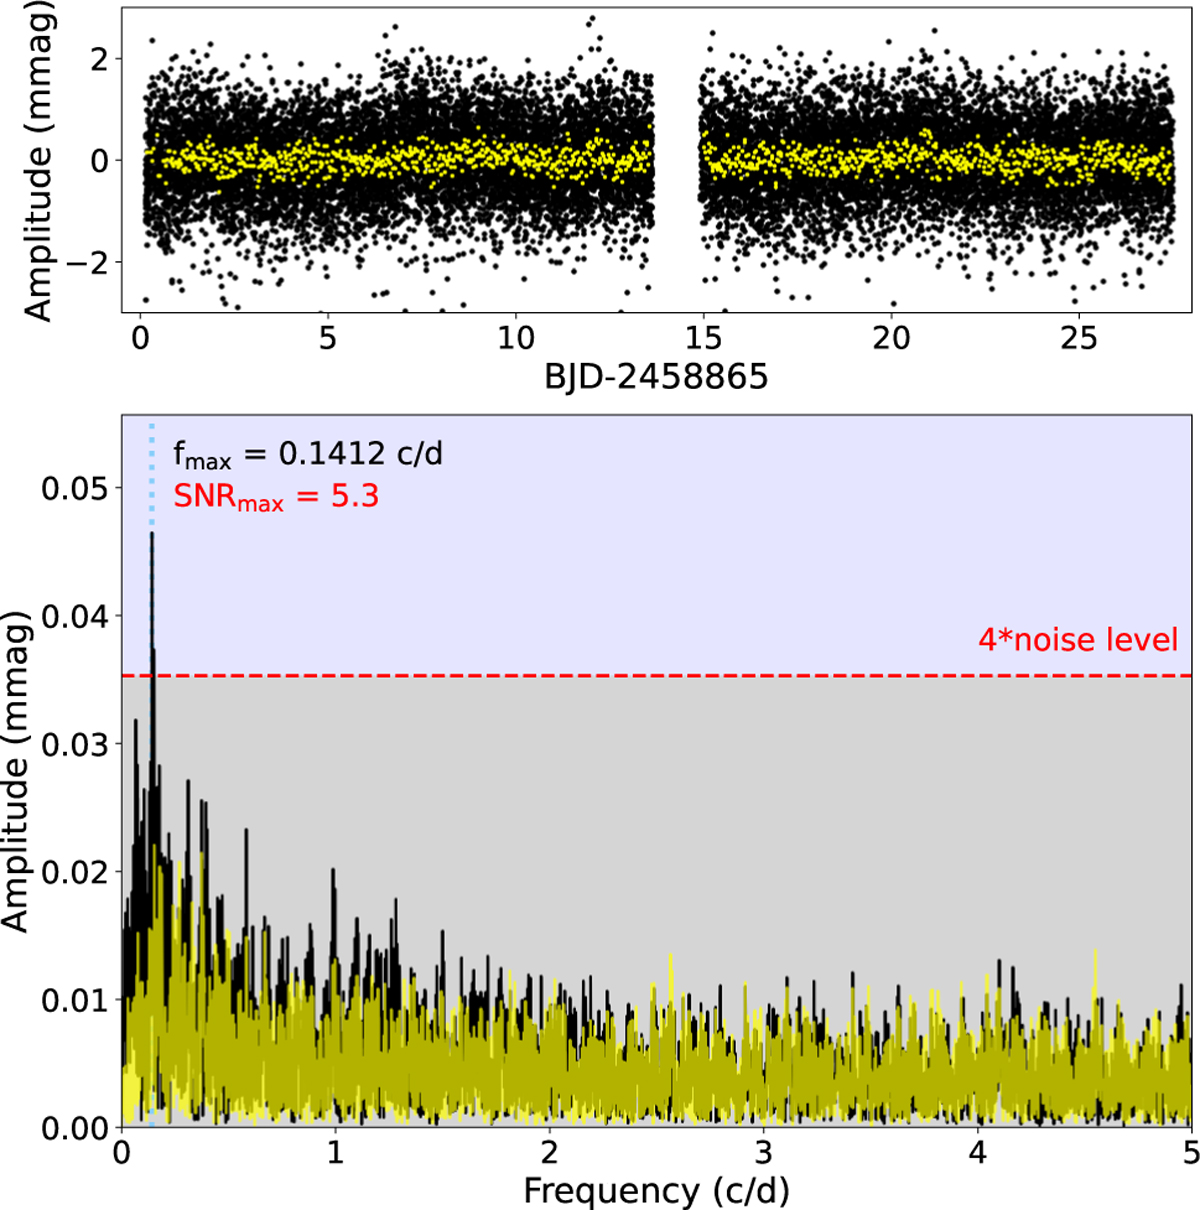
SPOC data of TIC 2116199 from sector 14 (top panel) and frequency spectra based on four available sectors with a time span of 352 days (bottom panel). The LC data and the corresponding frequency spectrum are shown with yellow, and the SC data and the corresponding frequency spectrum with black. The horizontal dashed red line shows four times the noise level limit, while the vertical dotted blue line shows the most significant frequency
Current usage metrics show cumulative count of Article Views (full-text article views including HTML views, PDF and ePub downloads, according to the available data) and Abstracts Views on Vision4Press platform.
Data correspond to usage on the plateform after 2015. The current usage metrics is available 48-96 hours after online publication and is updated daily on week days.
Initial download of the metrics may take a while.