Fig. 5
Download original image
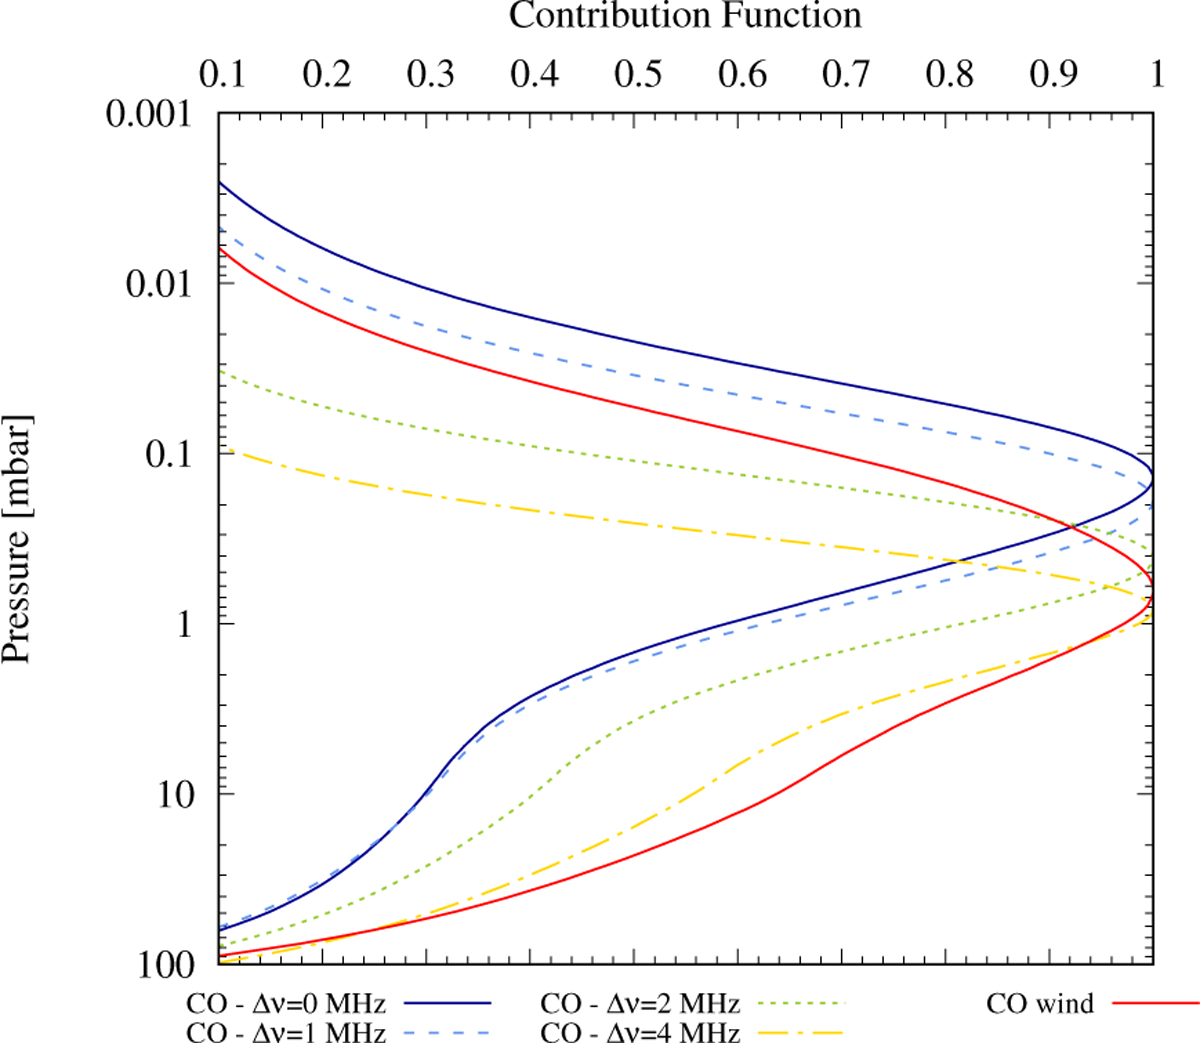
Contribution functions (normalized to unity at maximum) of the CO (3–2) line in the atmosphere of Saturn. The solid blue, dashed, dotted, and dash-dotted curves represent examples of monochromatic contribution functions calculated at 0, 1, 2, and 4 MHz from the line centre, respectively. The solid red curve represents the wind contribution function (see text).
Current usage metrics show cumulative count of Article Views (full-text article views including HTML views, PDF and ePub downloads, according to the available data) and Abstracts Views on Vision4Press platform.
Data correspond to usage on the plateform after 2015. The current usage metrics is available 48-96 hours after online publication and is updated daily on week days.
Initial download of the metrics may take a while.