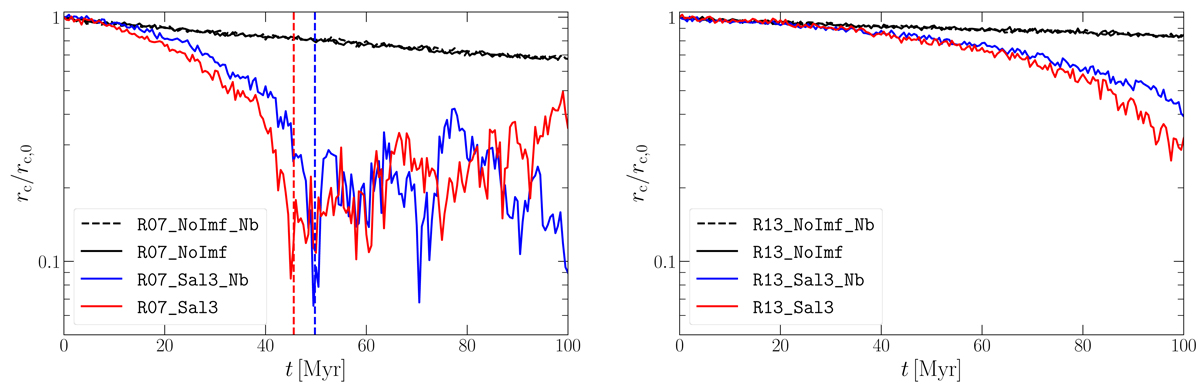
Fig. 1.
Download original image
Evolution of the core radius, see Eq. (1), normalised to the initial core radius. The plots show the clusters with the Salpeter IMF or equal-mass stars, both isolated and embedded into the environment (as labelled in the legends, we note that the two black lines are almost superimposed). The left-hand plot shows the more compact models with rvir = 0.7 pc, the right-hand one is for rvir = 1.3 pc. The moments of core collapse are highlighted with a vertical line.
Current usage metrics show cumulative count of Article Views (full-text article views including HTML views, PDF and ePub downloads, according to the available data) and Abstracts Views on Vision4Press platform.
Data correspond to usage on the plateform after 2015. The current usage metrics is available 48-96 hours after online publication and is updated daily on week days.
Initial download of the metrics may take a while.