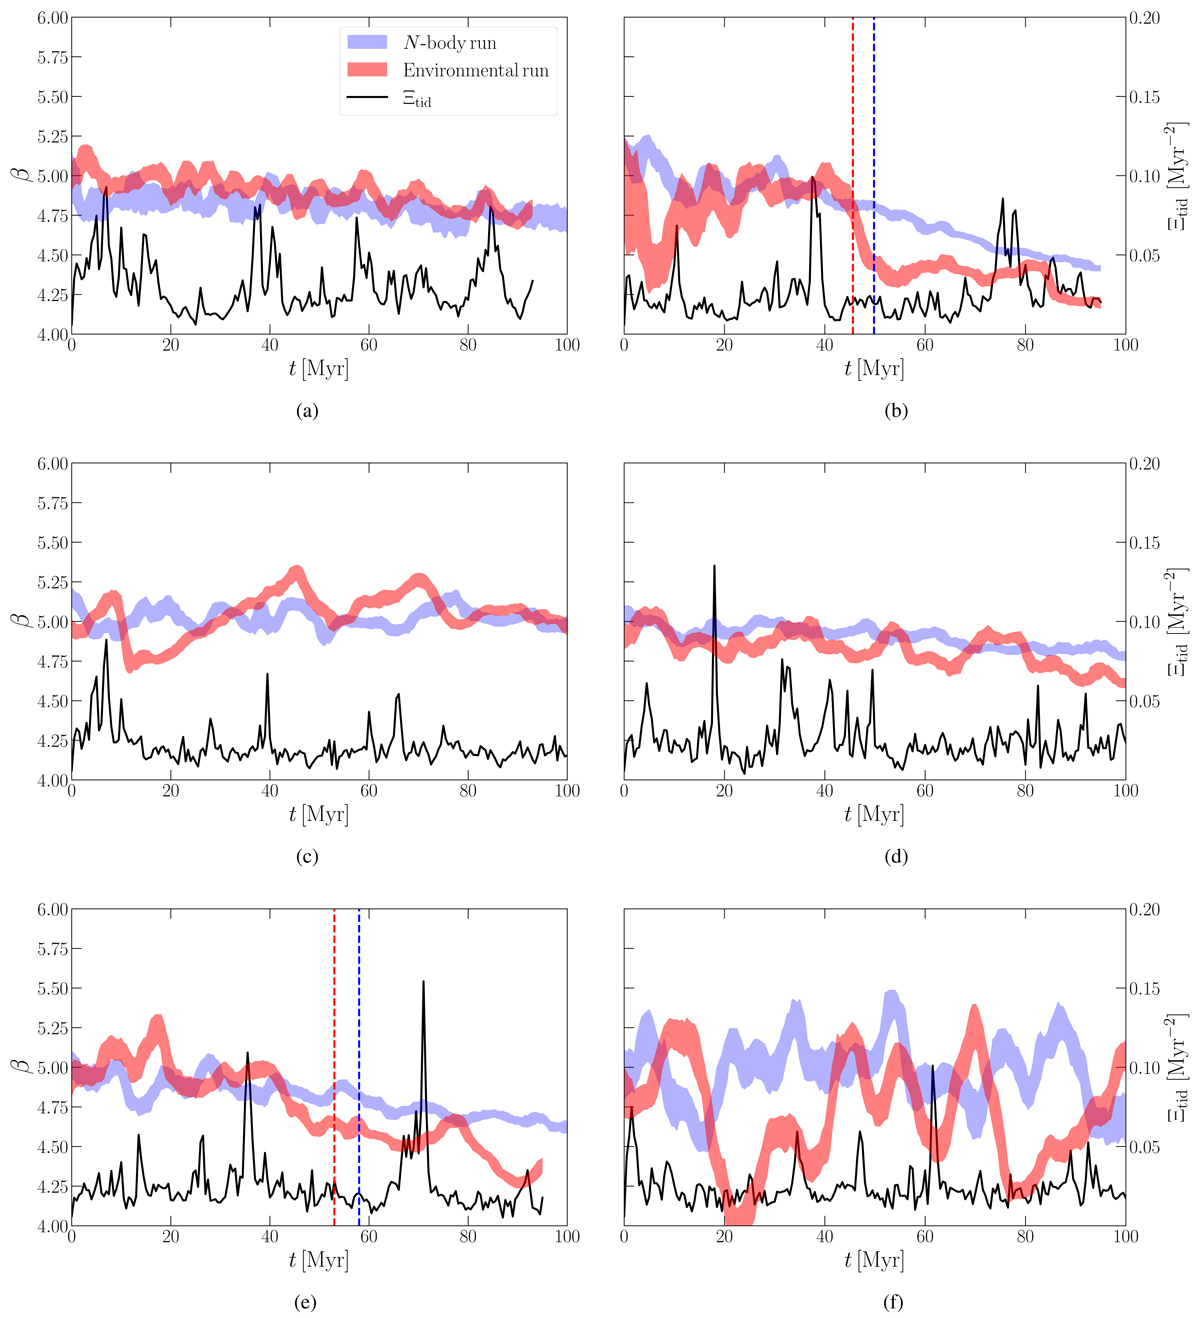
Fig. 3.
Download original image
Evolution of β throughout a selected set of simulations, with the axis on the left. The shaded areas identify the value of the fit within 1σ (blue for the N-body runs, red for those with environment). We smoothed the data with a simple moving weighted average of width 2.5 Myr (5 model outputs). The black line shows the value of Ξtid of the environmental runs, as in Fig. 2 (axis on the right). The vertical dashed lines in the plots (b) and (e) highlight the moment of core collapse (see also Table 1). (a) R07_NoImf, (b) R07_Sal3, (c) R13_NoImf, (d) R13_Sal3, (e) R13_Sal6, (f) R30_Sal6.
Current usage metrics show cumulative count of Article Views (full-text article views including HTML views, PDF and ePub downloads, according to the available data) and Abstracts Views on Vision4Press platform.
Data correspond to usage on the plateform after 2015. The current usage metrics is available 48-96 hours after online publication and is updated daily on week days.
Initial download of the metrics may take a while.