Fig. 5
Download original image
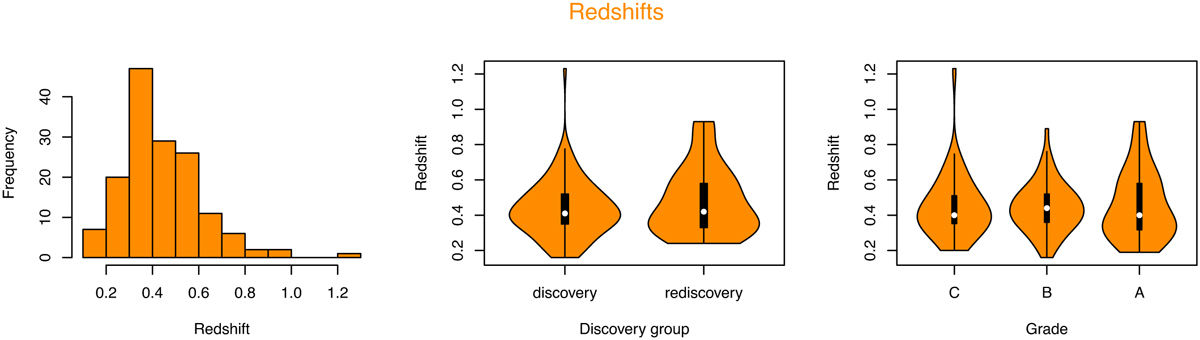
Distributions of redshifts. The left panel shows a histogram of photometric and spectroscopic redshifts retrieved with SDSS and NED. The middle panel uses violin plots to show the respective empirical distributions of discovered and rediscovered lenses, while the right panel shows plots per grade groups. The violin plots were fitted using a Gaussian kernel, with the software R.
Current usage metrics show cumulative count of Article Views (full-text article views including HTML views, PDF and ePub downloads, according to the available data) and Abstracts Views on Vision4Press platform.
Data correspond to usage on the plateform after 2015. The current usage metrics is available 48-96 hours after online publication and is updated daily on week days.
Initial download of the metrics may take a while.