Fig. 6
Download original image
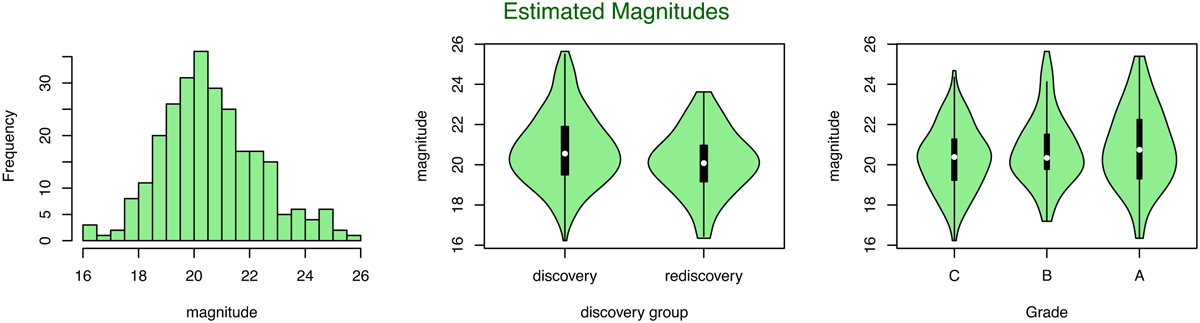
Distributions of magnitudes. The left panel shows a histogram distribution of the apparent magnitudes as measured with GALFIT (see Tables A.l and A.2 for description of the filters used). The middle panel shows violin plots of the respective empirical distributions of discovered and rediscovered lenses, while the right panel shows the empirical distributions of magnitudes for each grade group.
Current usage metrics show cumulative count of Article Views (full-text article views including HTML views, PDF and ePub downloads, according to the available data) and Abstracts Views on Vision4Press platform.
Data correspond to usage on the plateform after 2015. The current usage metrics is available 48-96 hours after online publication and is updated daily on week days.
Initial download of the metrics may take a while.