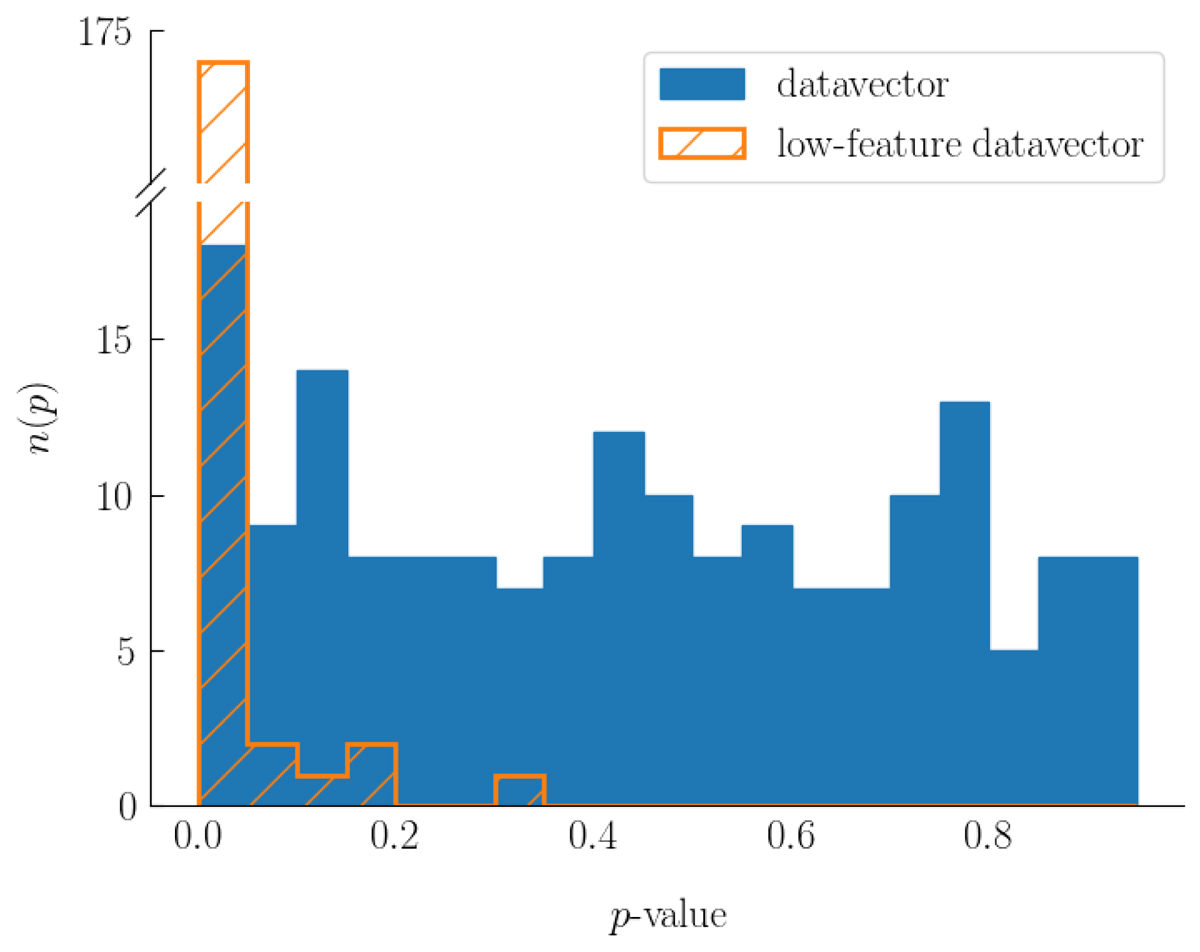
Fig. A.2.
Download original image
Test results for the final data-vector’s Gaussianity. For each of the 180 data vector entries, we take the set of 10 × 124 measurements in the Covariance Training Sample and test the null hypothesis that this sample was drawn from a normal distribution using the measured skewness and kurtosis (D’Agostino 1971; D’Agostino & Pearson 1973). We then plot a histogram of the corresponding p-values (blue). If each entry of the data vector is Gaussian, then the distribution of p-values is uniform. For comparison, we show the results of the same test with a data vector that contains only points with about 10 features (orange). While the blue histogram may show small deviations from a uniform distribution (there appears to be a downward slope towards higher p-values), we believe that the assumption of a normal distribution is reasonable.
Current usage metrics show cumulative count of Article Views (full-text article views including HTML views, PDF and ePub downloads, according to the available data) and Abstracts Views on Vision4Press platform.
Data correspond to usage on the plateform after 2015. The current usage metrics is available 48-96 hours after online publication and is updated daily on week days.
Initial download of the metrics may take a while.