Fig. 1.
Download original image
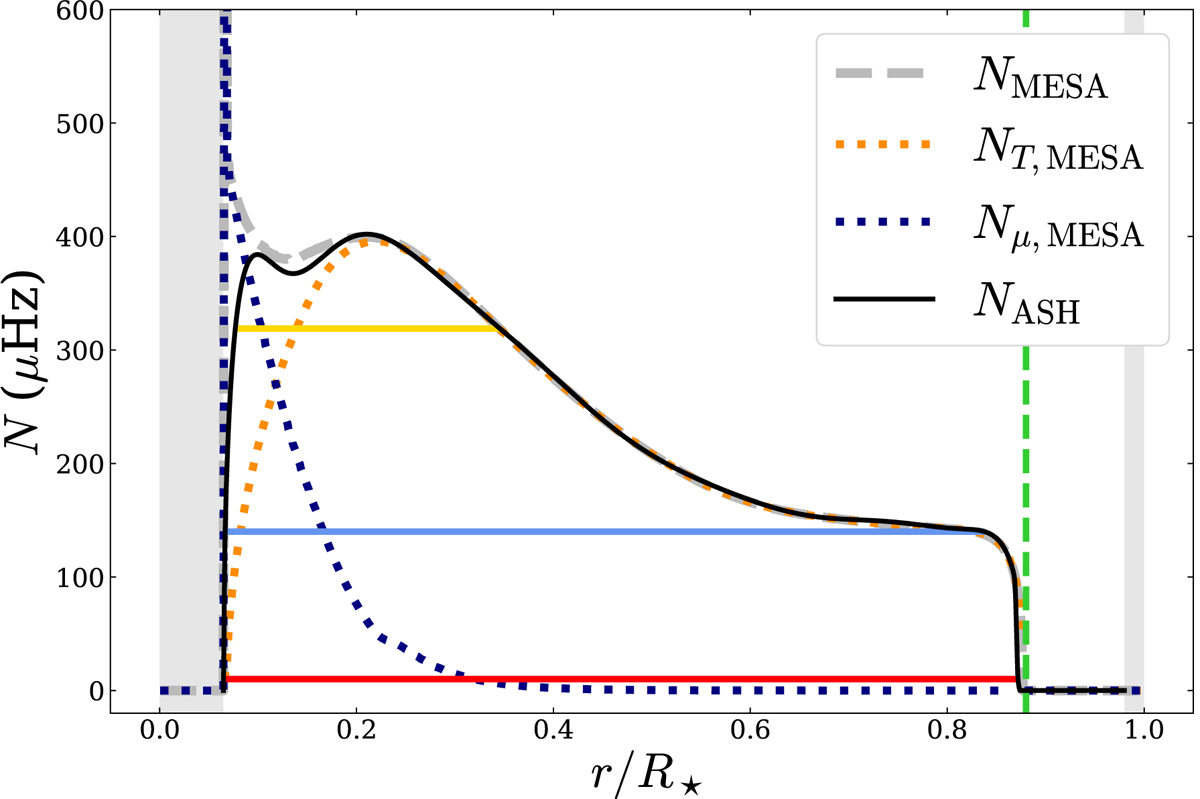
Radial profiles of the Brunt-Väisälä frequency N in the ASH model (black) and the MESA model (dashed grey). The structural and chemical contributions to NMESA, NT, MESA, and Nμ, MESA, are represented in dotted-orange and dotted-dark-blue lines, respectively. The dashed green vertical line shows the boundary between the radiative zone and the convective envelope, while the grey hatched regions are excluded from the simulation domain. The frequency corresponding to the ray paths of Fig. 15 are represented by the solid horizontal red, blue, and yellow lines.
Current usage metrics show cumulative count of Article Views (full-text article views including HTML views, PDF and ePub downloads, according to the available data) and Abstracts Views on Vision4Press platform.
Data correspond to usage on the plateform after 2015. The current usage metrics is available 48-96 hours after online publication and is updated daily on week days.
Initial download of the metrics may take a while.