Open Access
Fig. 12.
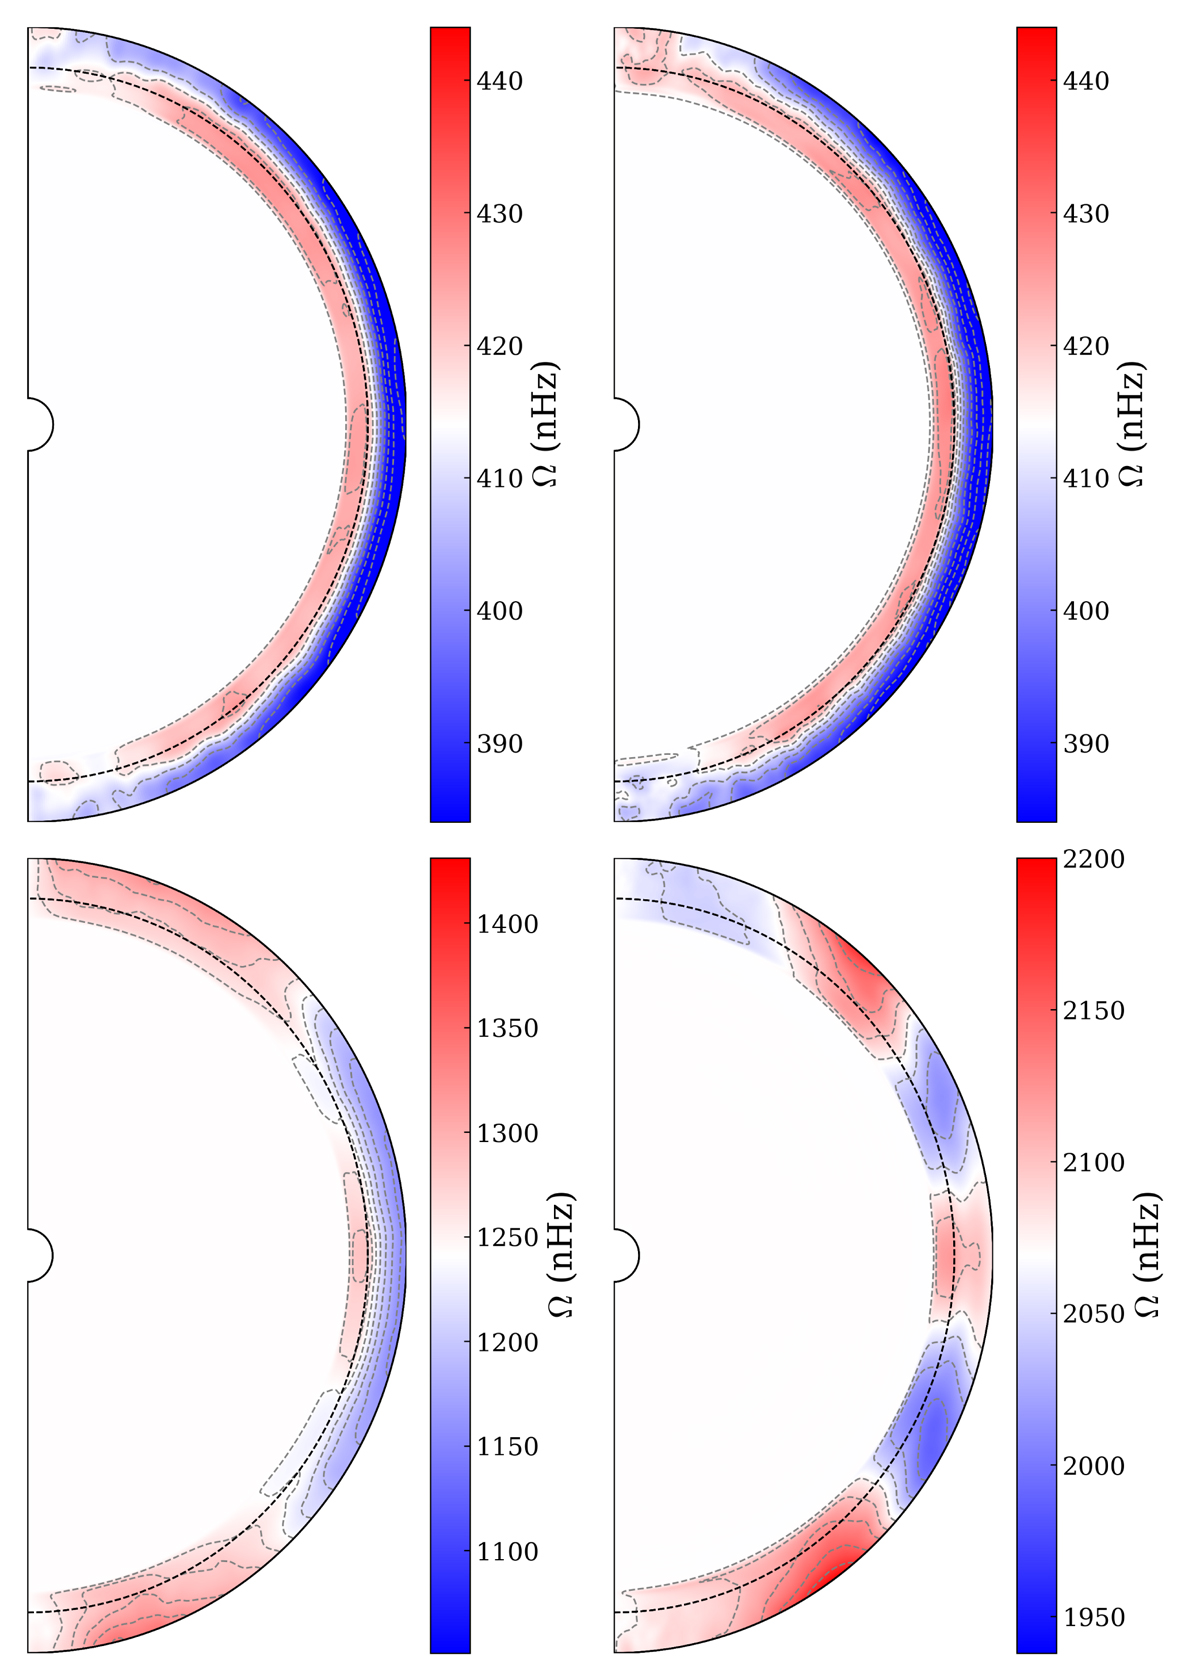
Download original image
Differential rotation for F1a (top left), F1b (top left), F3 (bottom left), and F5 (bottom right) cases. Retrograde and prograde (relatively to the co-rotational frame) flows are shown in blue and red, respectively. The dashed black line corresponds to rCZ and the dashed grey lines are isocontours.
Current usage metrics show cumulative count of Article Views (full-text article views including HTML views, PDF and ePub downloads, according to the available data) and Abstracts Views on Vision4Press platform.
Data correspond to usage on the plateform after 2015. The current usage metrics is available 48-96 hours after online publication and is updated daily on week days.
Initial download of the metrics may take a while.