Fig. 14.
Download original image
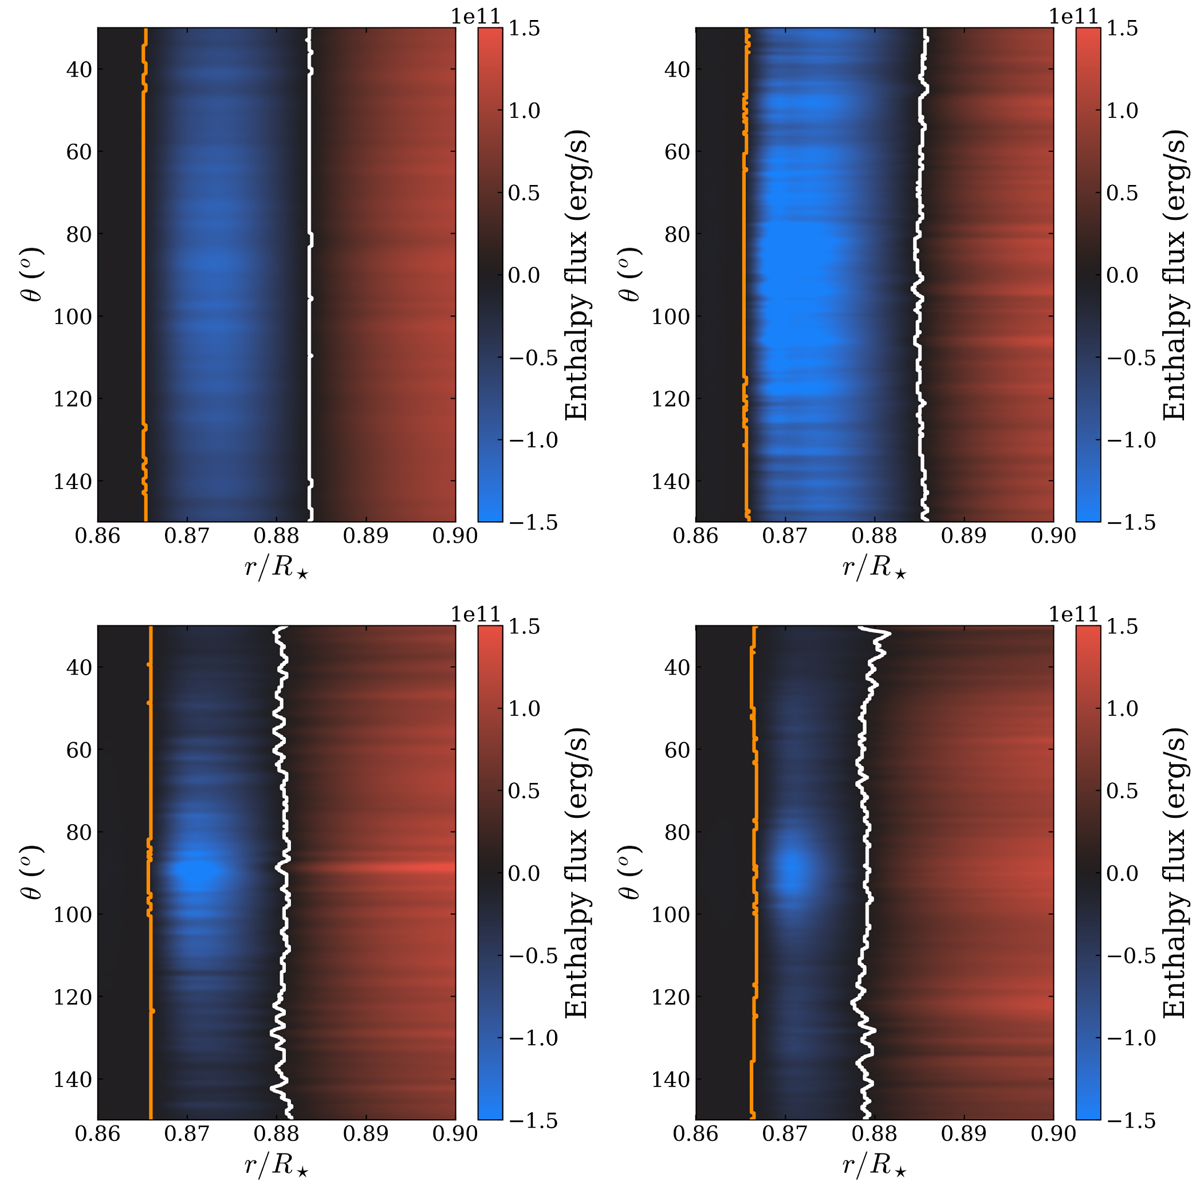
Overshoot region (blue) and bottom of the convective zone (red) in the F1a (top left), F1b (top right), F3 (bottom left), and F5 (bottom right) models, for θ spanning from 30 to 150 o. The white line show the radius rc at which the enthalpy flux crosses zero at a given latitude while the orange line signals the radius r0 where the local enthalpy flux is equal to a tenth of the maximal enthalpy flux at the corresponding latitude.
Current usage metrics show cumulative count of Article Views (full-text article views including HTML views, PDF and ePub downloads, according to the available data) and Abstracts Views on Vision4Press platform.
Data correspond to usage on the plateform after 2015. The current usage metrics is available 48-96 hours after online publication and is updated daily on week days.
Initial download of the metrics may take a while.