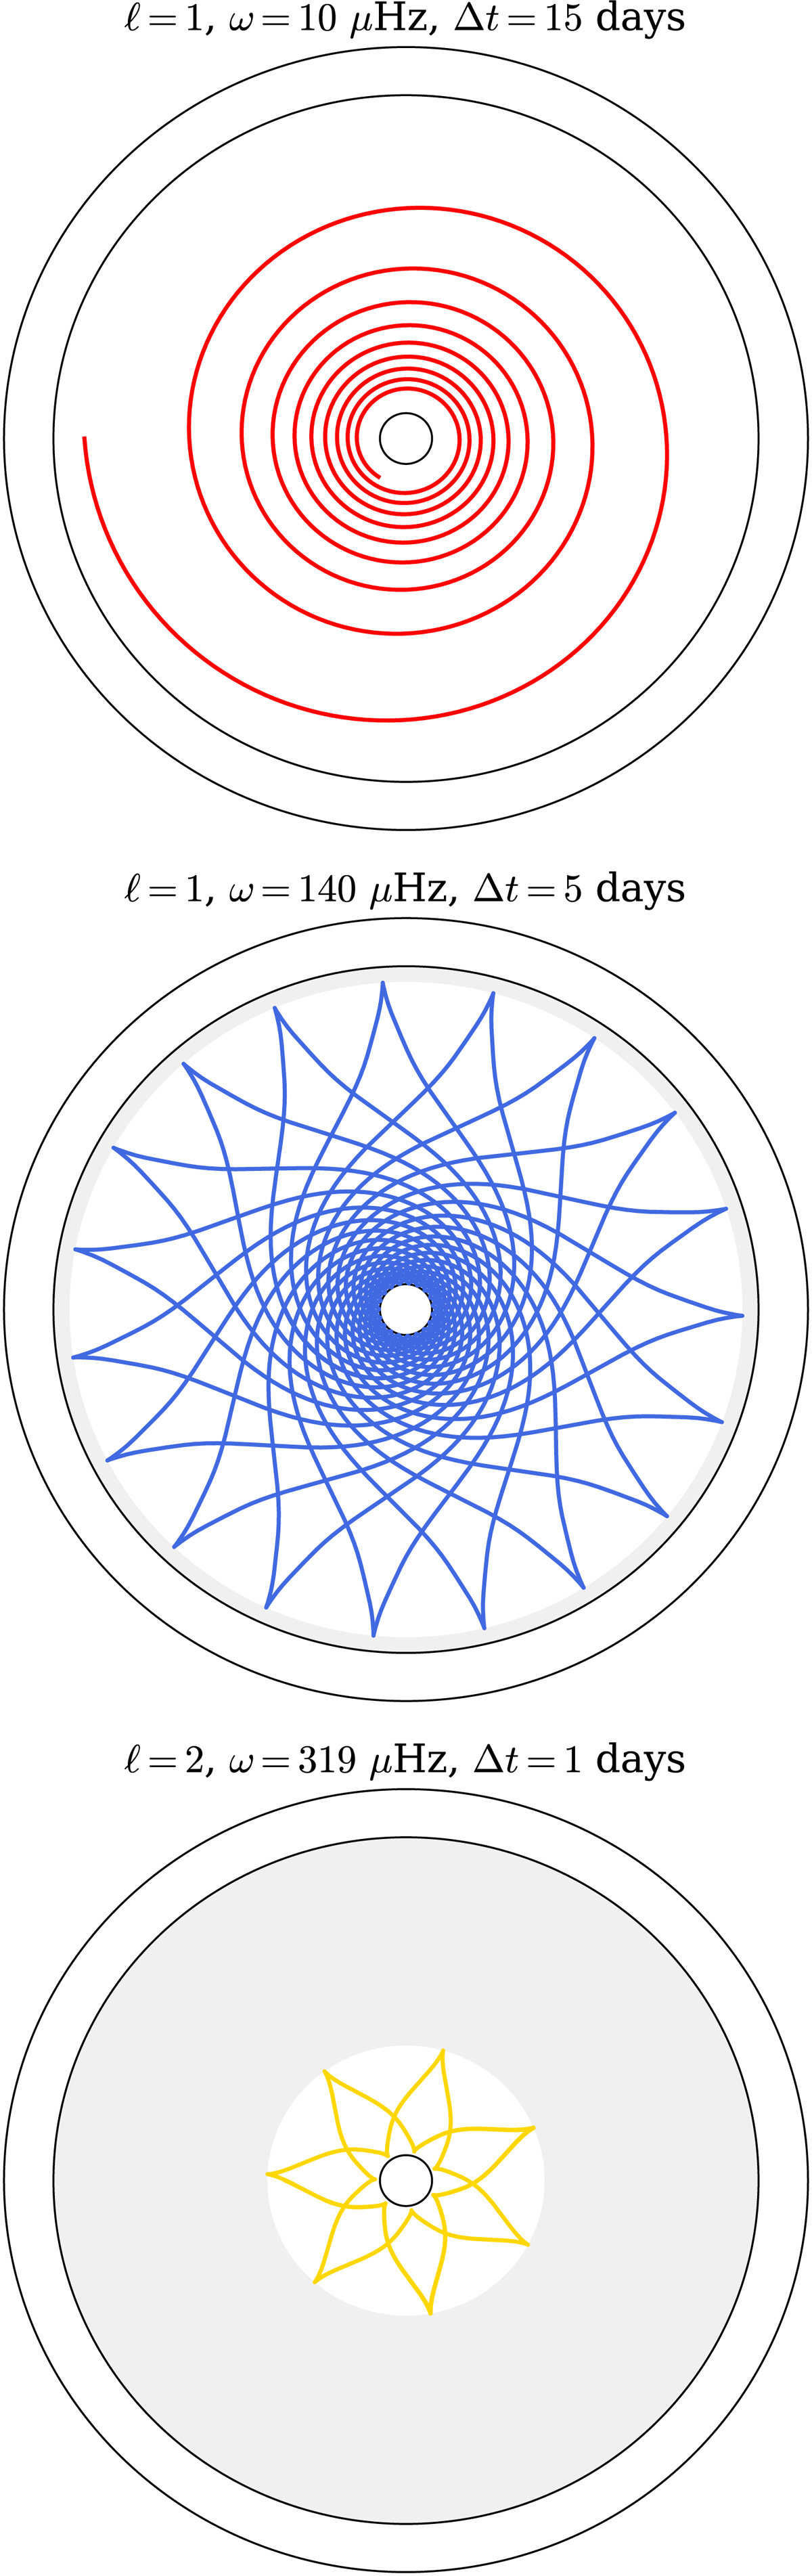
Fig. 15.
Download original image
Propagation path computed with ray-tracing for three IGWs: ℓ = 1, ω = 10 μHz (top), ℓ = 1, ω = 140 μHz (middle), ℓ = 2, ω = 319 μHz (bottom). The integration time, Δt, considered for each ray is specified. From the surface to the center, the black circles represent the position of the stellar surface, the bottom of the convective envelope and the edge of the convective core. The grey area corresponds to the part of the radiative zone where the wave is evanescent.
Current usage metrics show cumulative count of Article Views (full-text article views including HTML views, PDF and ePub downloads, according to the available data) and Abstracts Views on Vision4Press platform.
Data correspond to usage on the plateform after 2015. The current usage metrics is available 48-96 hours after online publication and is updated daily on week days.
Initial download of the metrics may take a while.