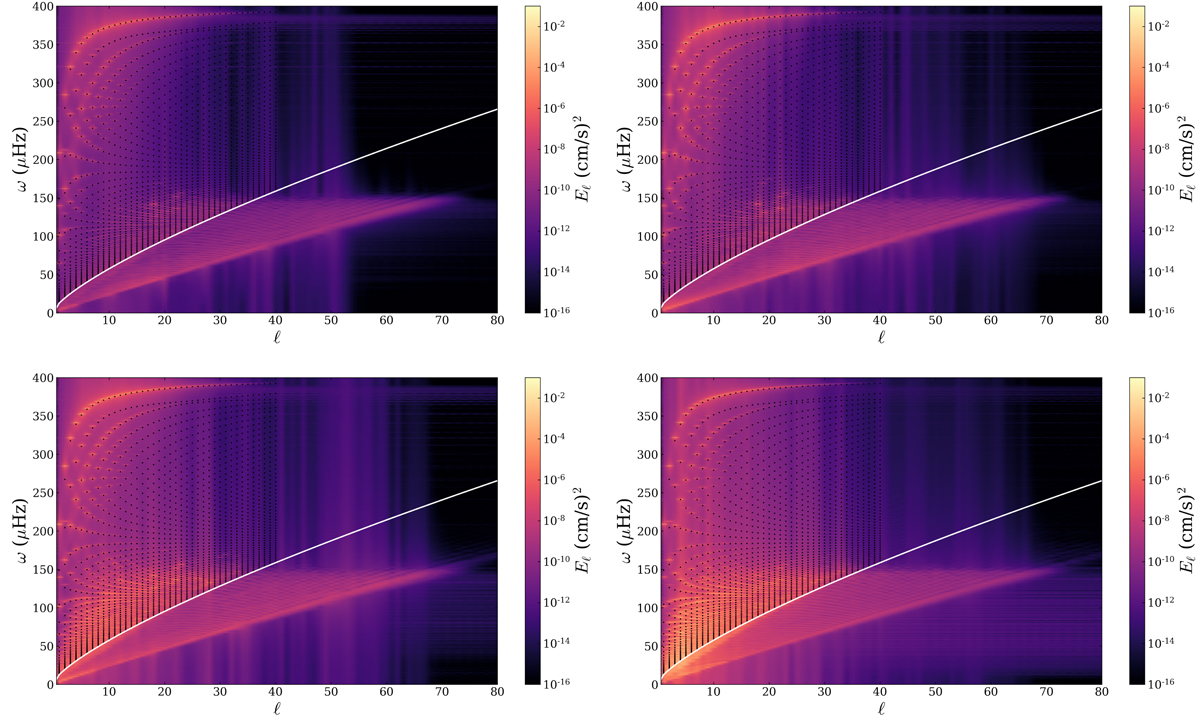
Fig. 17.
Download original image
Eℓ power spectrum at r = 0.18 R⋆ for the F1a (top left), F1b (top right), F3 (bottom left), and F5 (bottom) case. The mode frequencies computed with GYRE are overplotted (black dots) for ℓ = 1 to ℓ = 40. In each panel, the white line highlights the separation between the g-mode region (top left) and the progressive waves region (bottom right).
Current usage metrics show cumulative count of Article Views (full-text article views including HTML views, PDF and ePub downloads, according to the available data) and Abstracts Views on Vision4Press platform.
Data correspond to usage on the plateform after 2015. The current usage metrics is available 48-96 hours after online publication and is updated daily on week days.
Initial download of the metrics may take a while.