Fig. 18.
Download original image
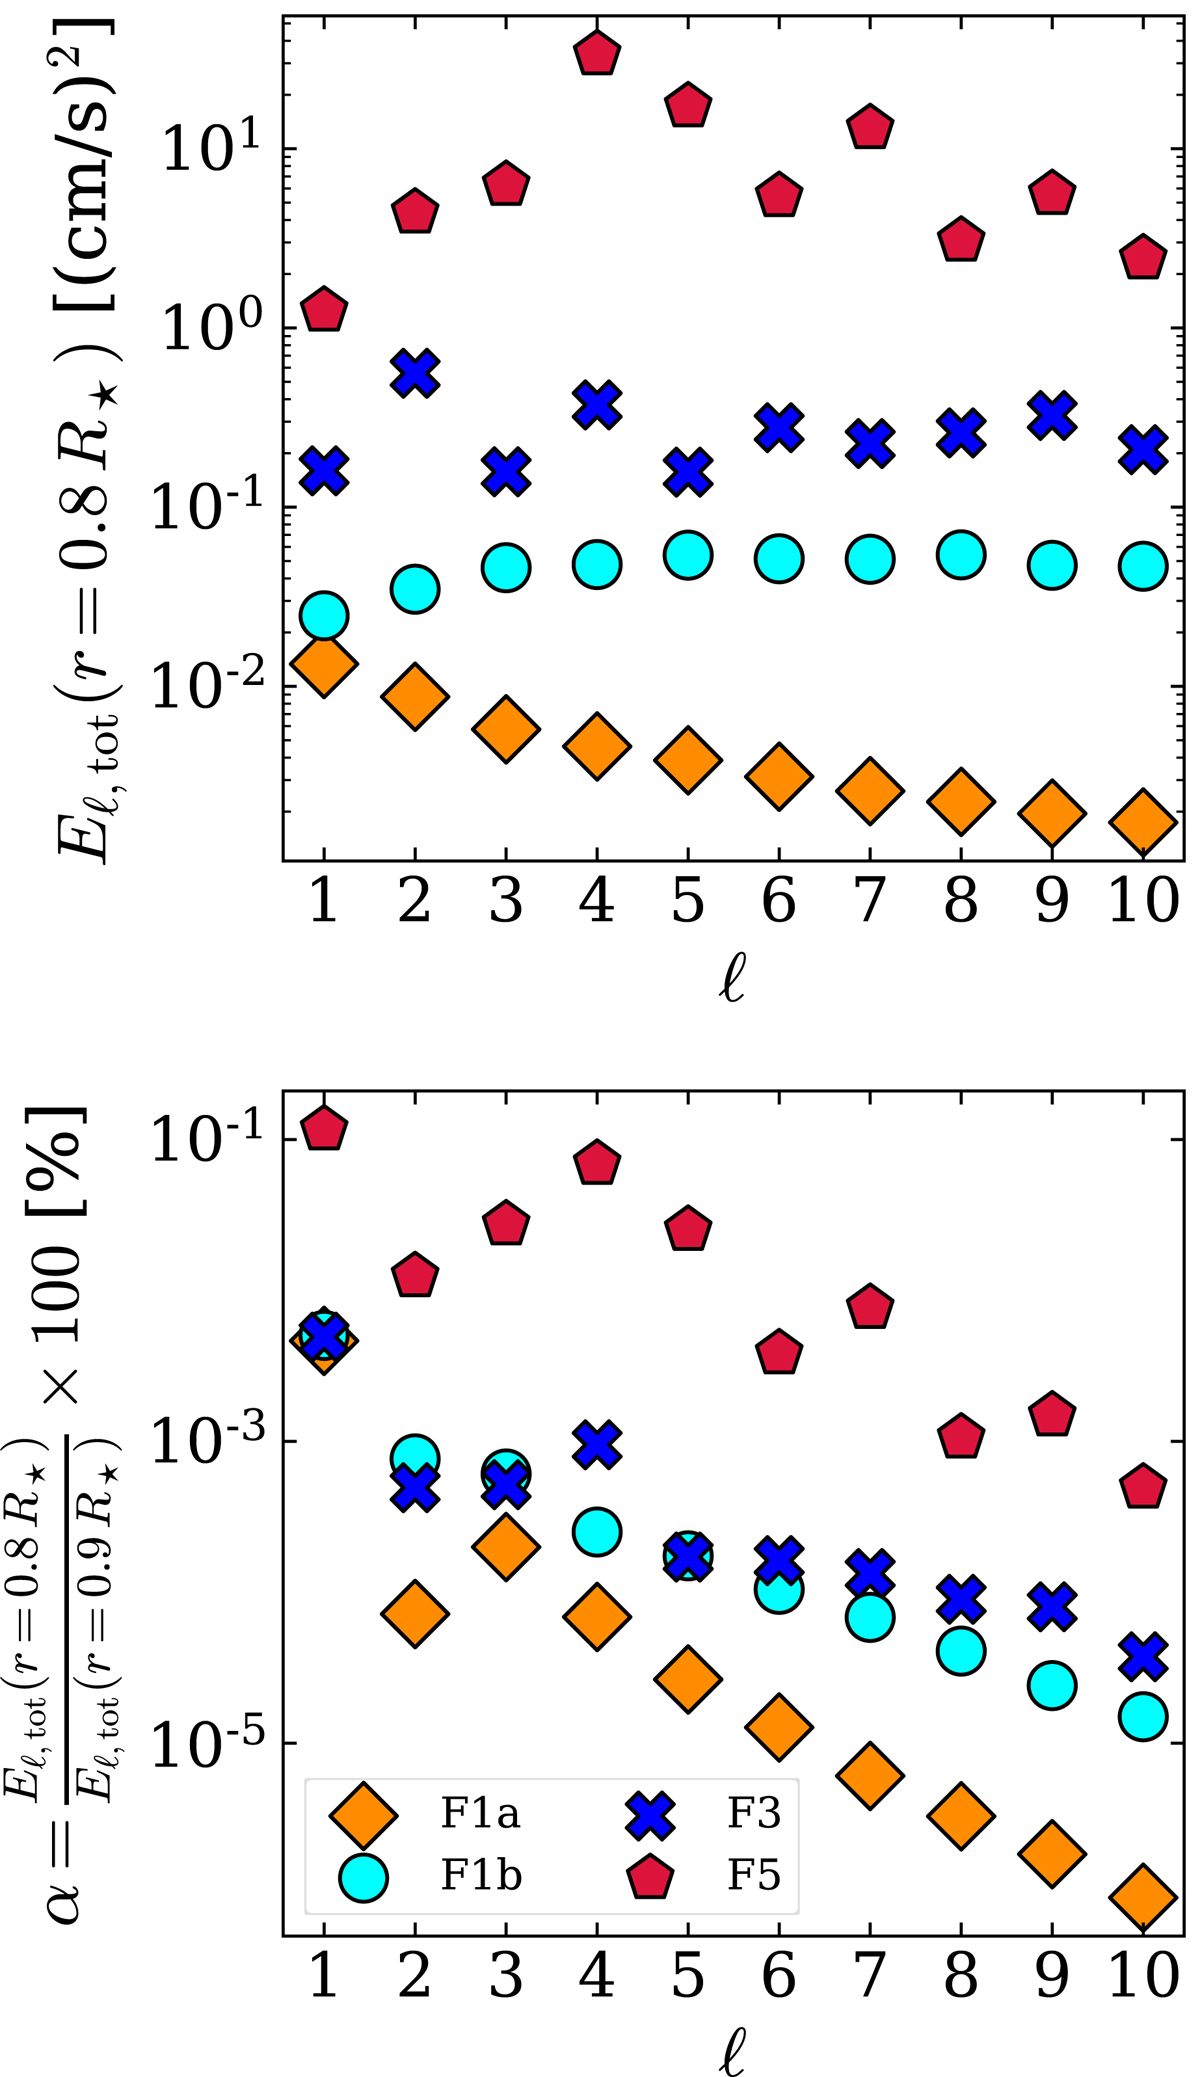
Amount of power injected in IGW. Top: total power Eℓ, tot for 1 ≤ ℓ ≤ 10 at r = 0.8 R⋆ for the F1a (orange diamonds), F1b (cyan circles) F3 (blue crosses), and F5 (red pentagons) cases. Bottom: ratio between Eℓ, tot(r = 0.8 R⋆), the radiative zone, and Eℓ, tot(r = 0.9 R⋆), convective zone. The same symbols and colour coding are used as in previous figures.
Current usage metrics show cumulative count of Article Views (full-text article views including HTML views, PDF and ePub downloads, according to the available data) and Abstracts Views on Vision4Press platform.
Data correspond to usage on the plateform after 2015. The current usage metrics is available 48-96 hours after online publication and is updated daily on week days.
Initial download of the metrics may take a while.