Fig. 24.
Download original image
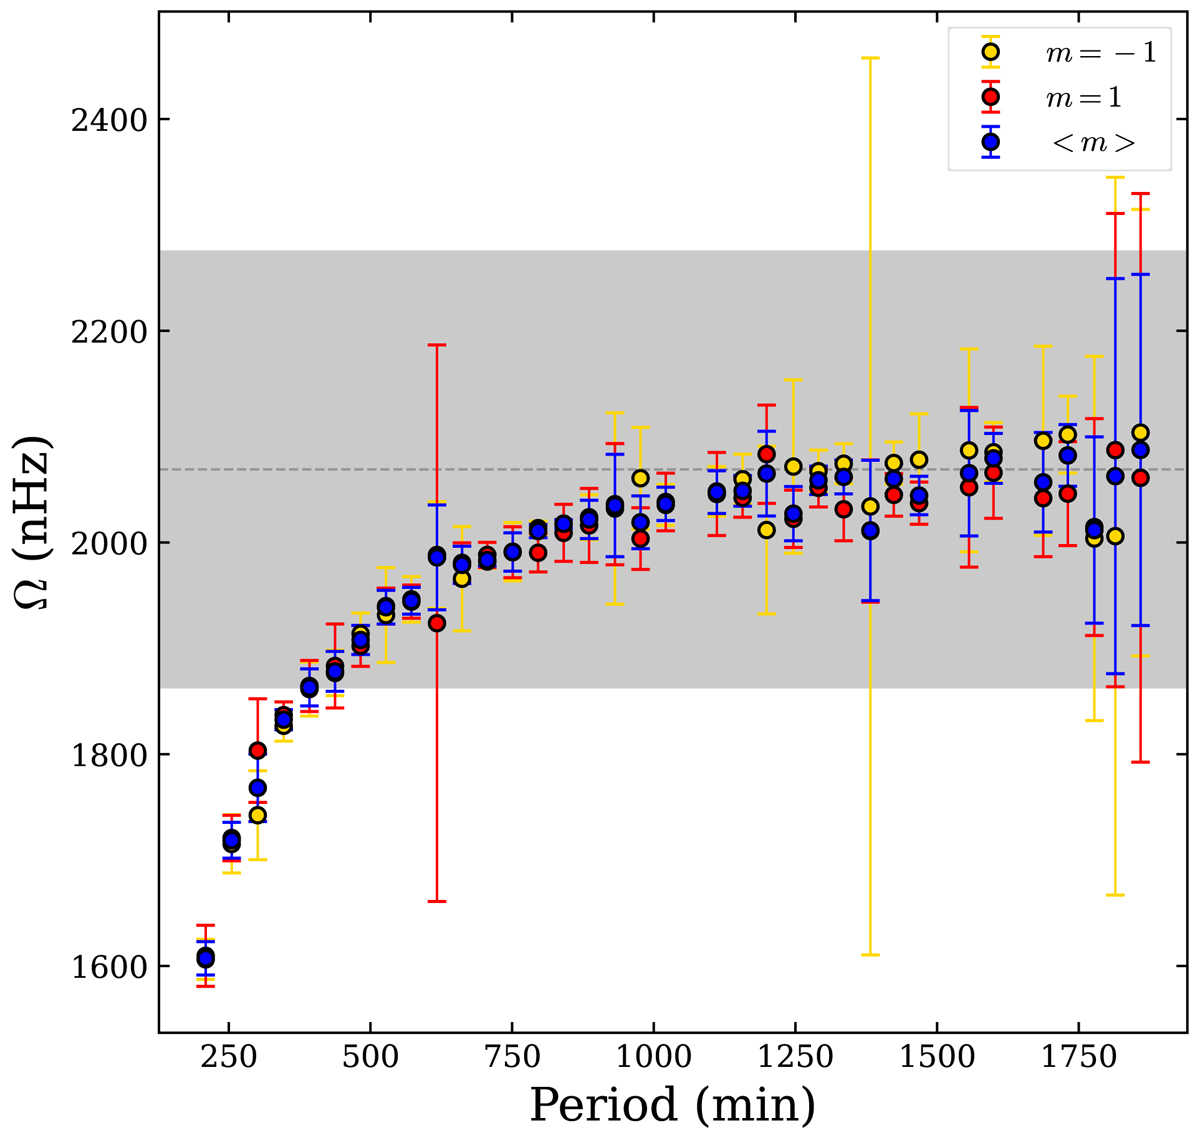
Rotation rate Ω inferred from the asymptotic approximation of Eqs. (27) and (29) with δn, 1, m measurements, in the F5 case. The position of the true rotation value of the model is highlighted by the dashed grey line, with the 10% error interval in grey. Rotation rate measured only with δn, 1, −1 and δn, 1, 1 are represented in yellow and red, respectively, while the averaged mean of the two values is shown in blue. The error bar for each Ω measurement is also represented.
Current usage metrics show cumulative count of Article Views (full-text article views including HTML views, PDF and ePub downloads, according to the available data) and Abstracts Views on Vision4Press platform.
Data correspond to usage on the plateform after 2015. The current usage metrics is available 48-96 hours after online publication and is updated daily on week days.
Initial download of the metrics may take a while.