Open Access
Fig. 27.
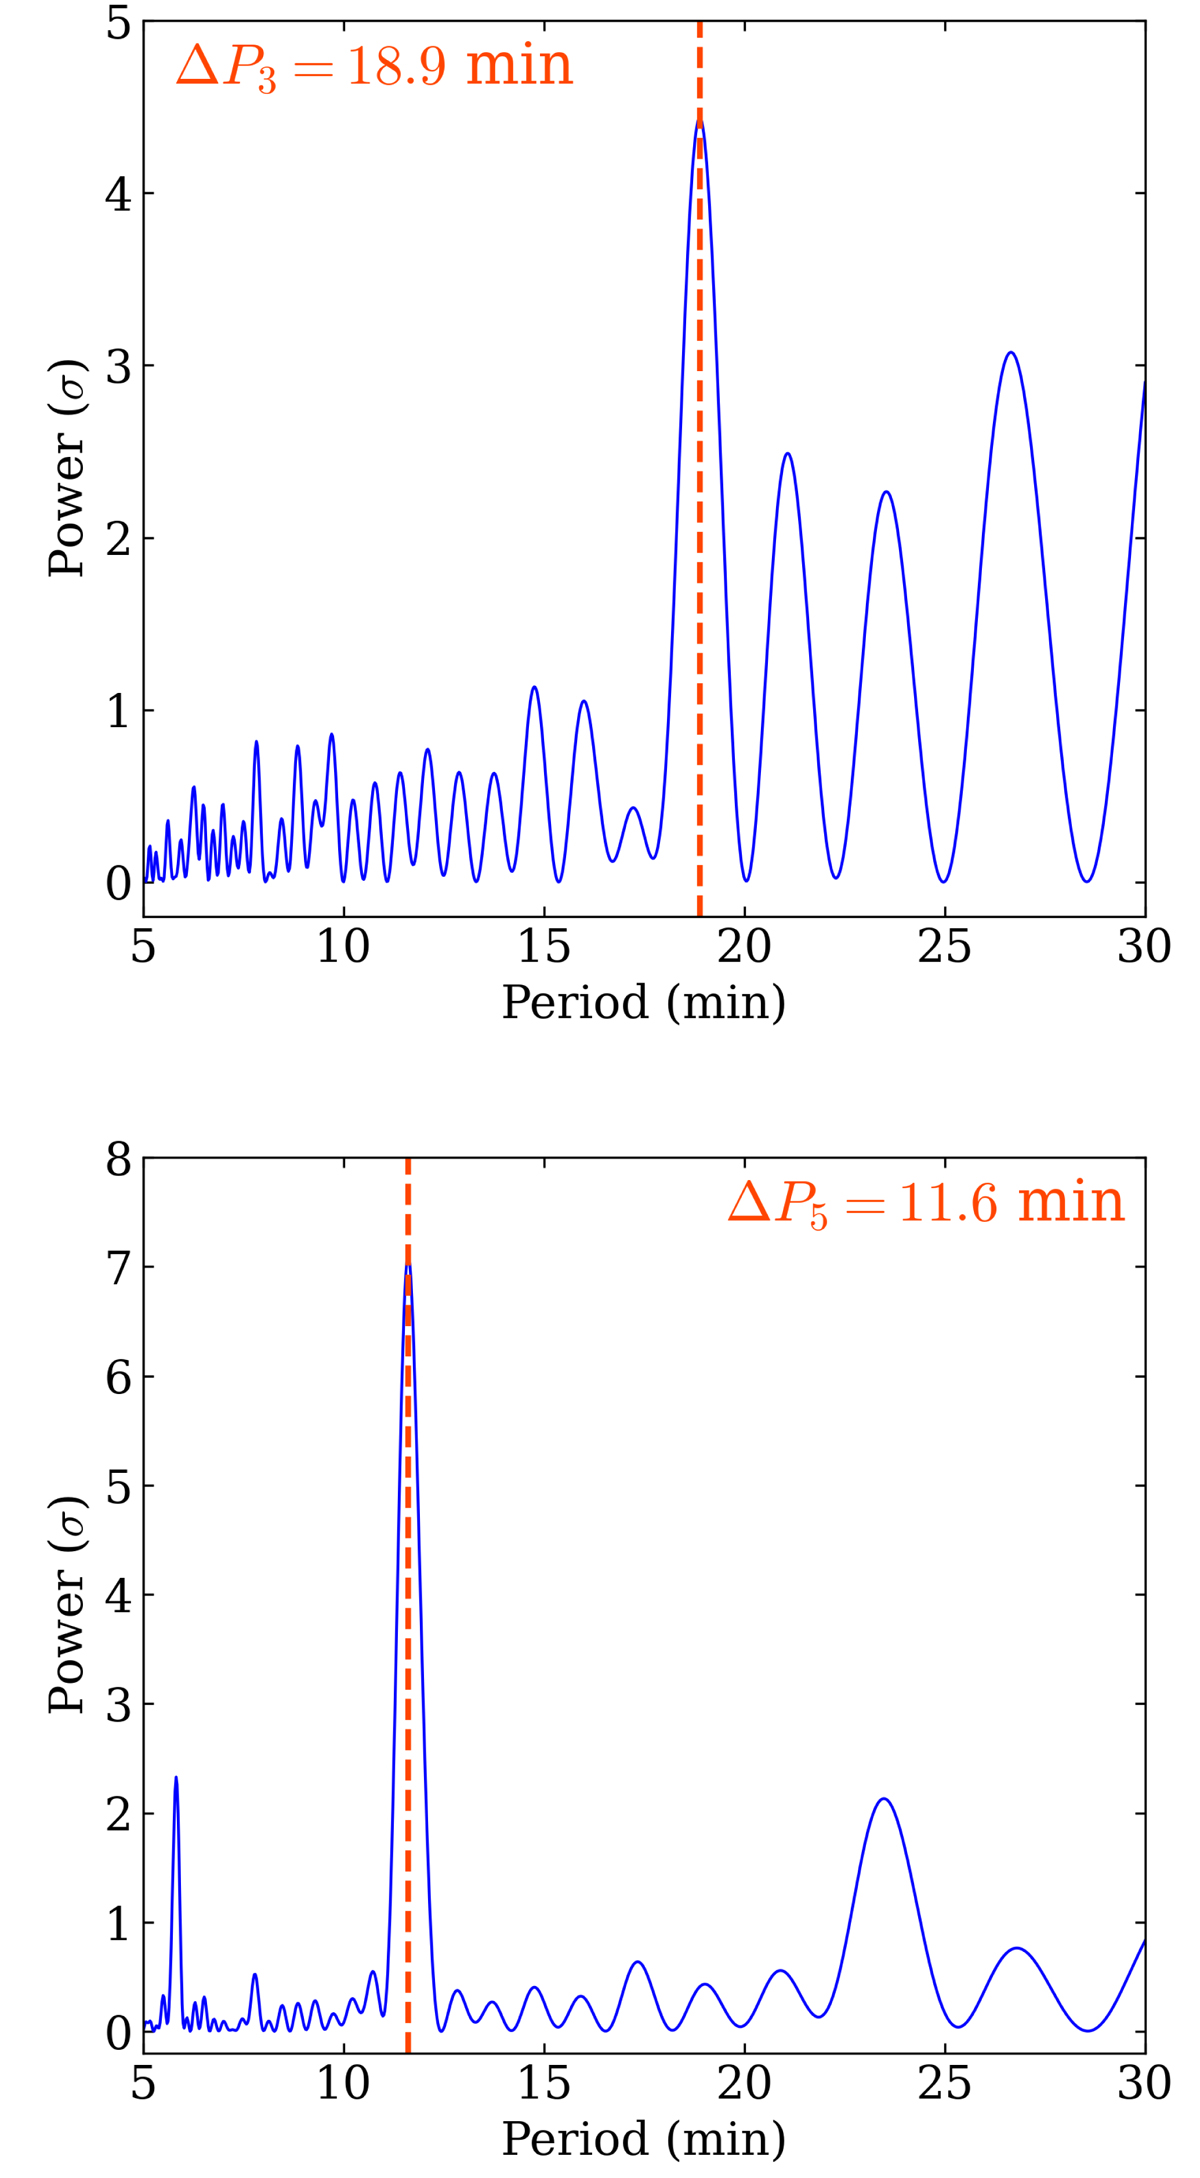
Download original image
Lomb-Scargle periodograms computed from E3 (0.97 R⋆, P) (top) and E5 (0.97 R⋆, P) (bottom). The periodogram is normalised with its standard deviation σ and the obtained ΔP3 value is shown by a vertical dashed red line.
Current usage metrics show cumulative count of Article Views (full-text article views including HTML views, PDF and ePub downloads, according to the available data) and Abstracts Views on Vision4Press platform.
Data correspond to usage on the plateform after 2015. The current usage metrics is available 48-96 hours after online publication and is updated daily on week days.
Initial download of the metrics may take a while.