Open Access
Fig. 4.
Download original image
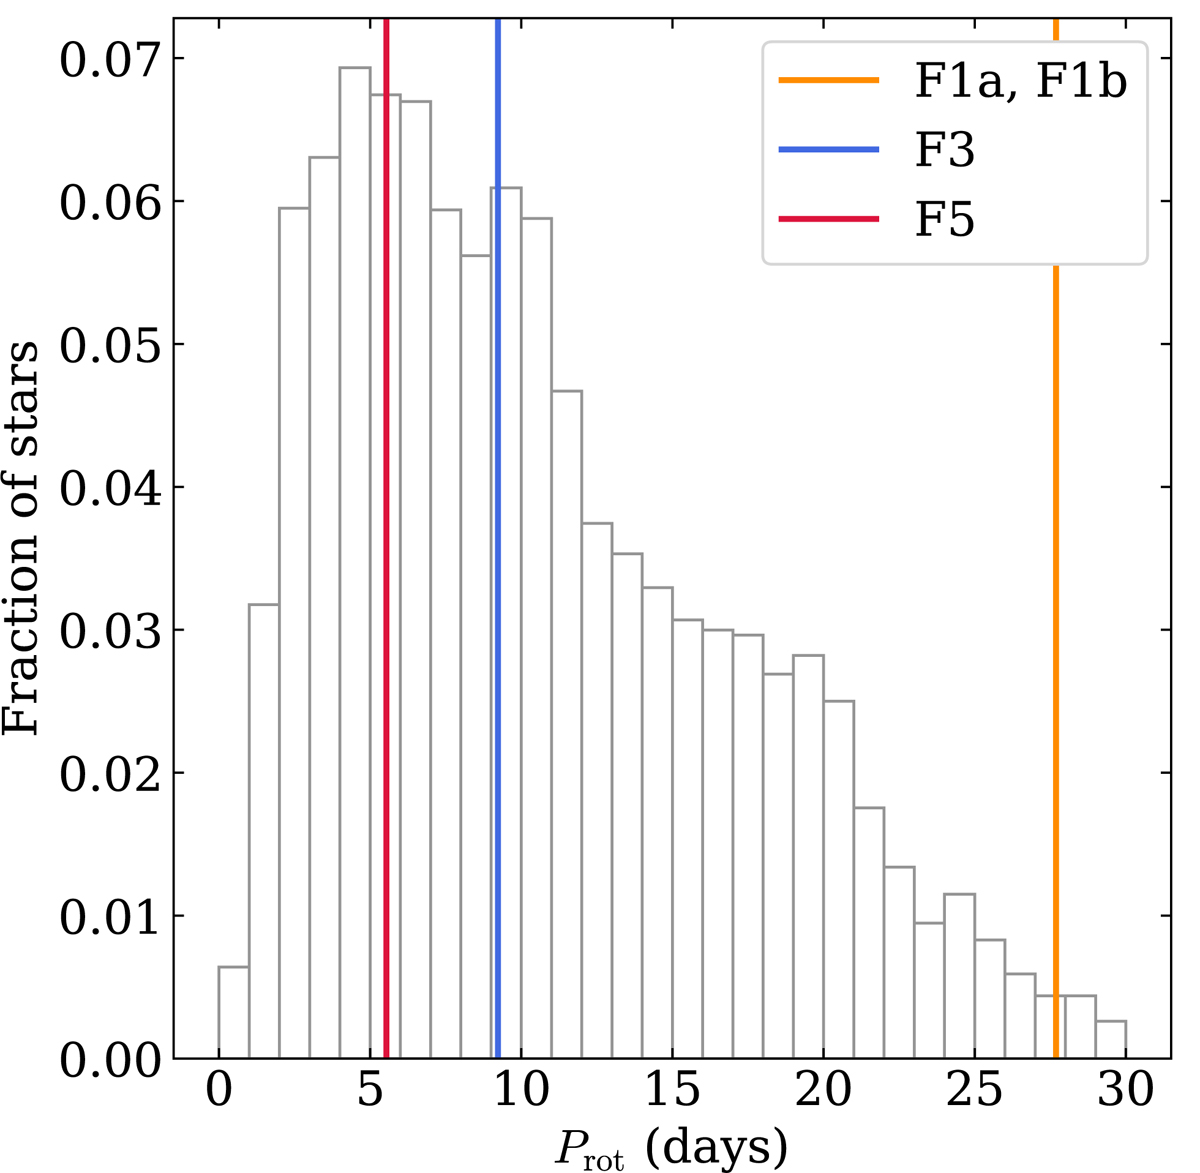
Distribution of surface rotation periods Prot measured by Santos et al. (2021) in the Kepler data, considering stars with 6000 < Teff < 6600 K and log g > 4 dex (using values from Berger et al. 2020). Vertical colour lines indicate the periods corresponding to the rotation rates selected for our simulations.
Current usage metrics show cumulative count of Article Views (full-text article views including HTML views, PDF and ePub downloads, according to the available data) and Abstracts Views on Vision4Press platform.
Data correspond to usage on the plateform after 2015. The current usage metrics is available 48-96 hours after online publication and is updated daily on week days.
Initial download of the metrics may take a while.