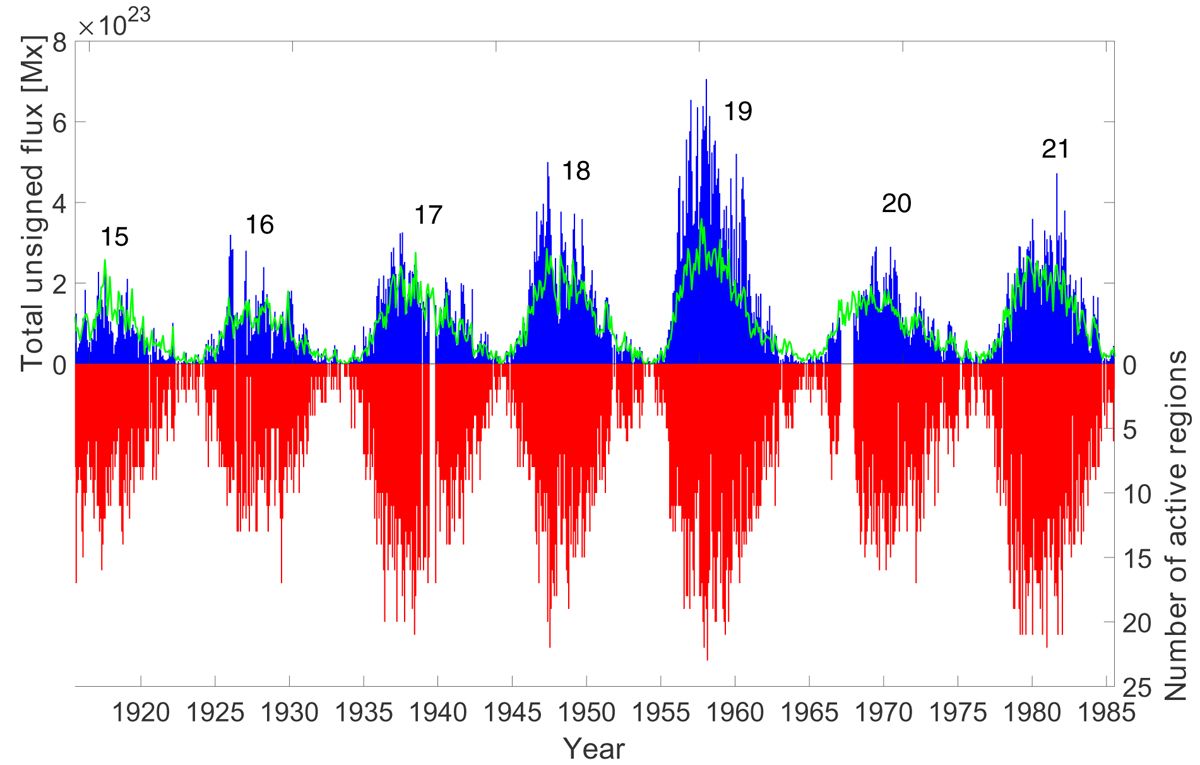
Fig. 2.
Download original image
Total unsigned magnetic flux in each Carrington rotation (blue bars) and number of active regions in each Carrington rotation (red bars). The monthly sunspot number, multiplied by 1022, is shown as a thick green line on top of the total flux in the upper part of the plot. The numbers above the blue bars are solar cycle numbers. Sunspot data from the World Data Center SILSO, Royal Observatory of Belgium, Brussels.
Current usage metrics show cumulative count of Article Views (full-text article views including HTML views, PDF and ePub downloads, according to the available data) and Abstracts Views on Vision4Press platform.
Data correspond to usage on the plateform after 2015. The current usage metrics is available 48-96 hours after online publication and is updated daily on week days.
Initial download of the metrics may take a while.