Open Access
Fig. 4.
Download original image
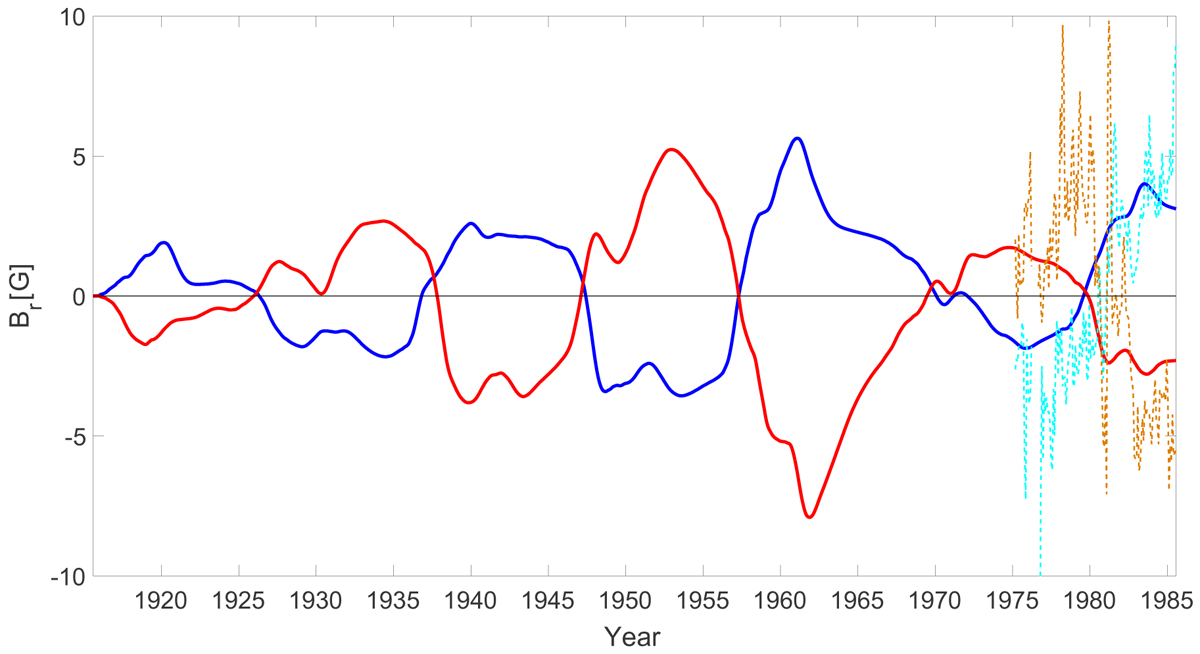
Average strength of the photospheric magnetic field above 60 deg and below −60 deg latitude. Solid red and blue lines are the northern and southern hemispheres of the reconstruction, respectively. Dashed orange and light blue lines are the northern and southern hemispheres of the NSO/KP synoptic maps, respectively.
Current usage metrics show cumulative count of Article Views (full-text article views including HTML views, PDF and ePub downloads, according to the available data) and Abstracts Views on Vision4Press platform.
Data correspond to usage on the plateform after 2015. The current usage metrics is available 48-96 hours after online publication and is updated daily on week days.
Initial download of the metrics may take a while.