Open Access
Fig. 5.
Download original image
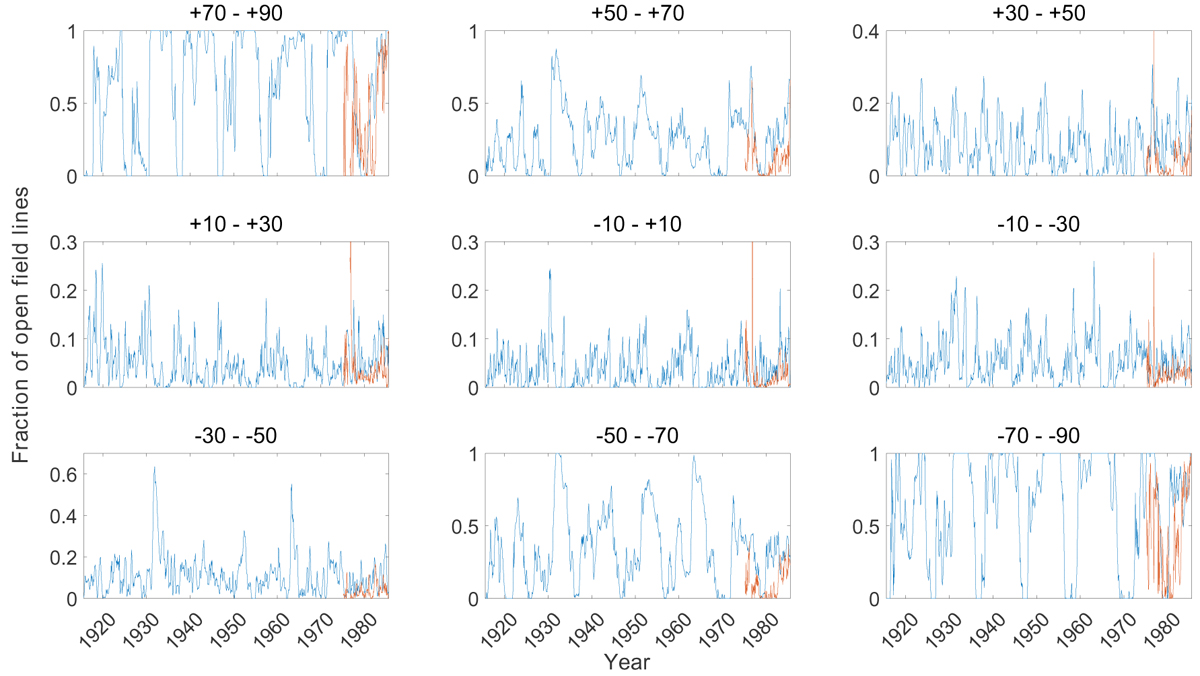
Fraction of photospheric surface area covered by open field lines in nine 20 deg latitude bands. The limits of each band are shown above the panels. Blue lines are from the reconstruction, red lines from NSO/KP maps.
Current usage metrics show cumulative count of Article Views (full-text article views including HTML views, PDF and ePub downloads, according to the available data) and Abstracts Views on Vision4Press platform.
Data correspond to usage on the plateform after 2015. The current usage metrics is available 48-96 hours after online publication and is updated daily on week days.
Initial download of the metrics may take a while.