Open Access
Fig. 1.
Download original image
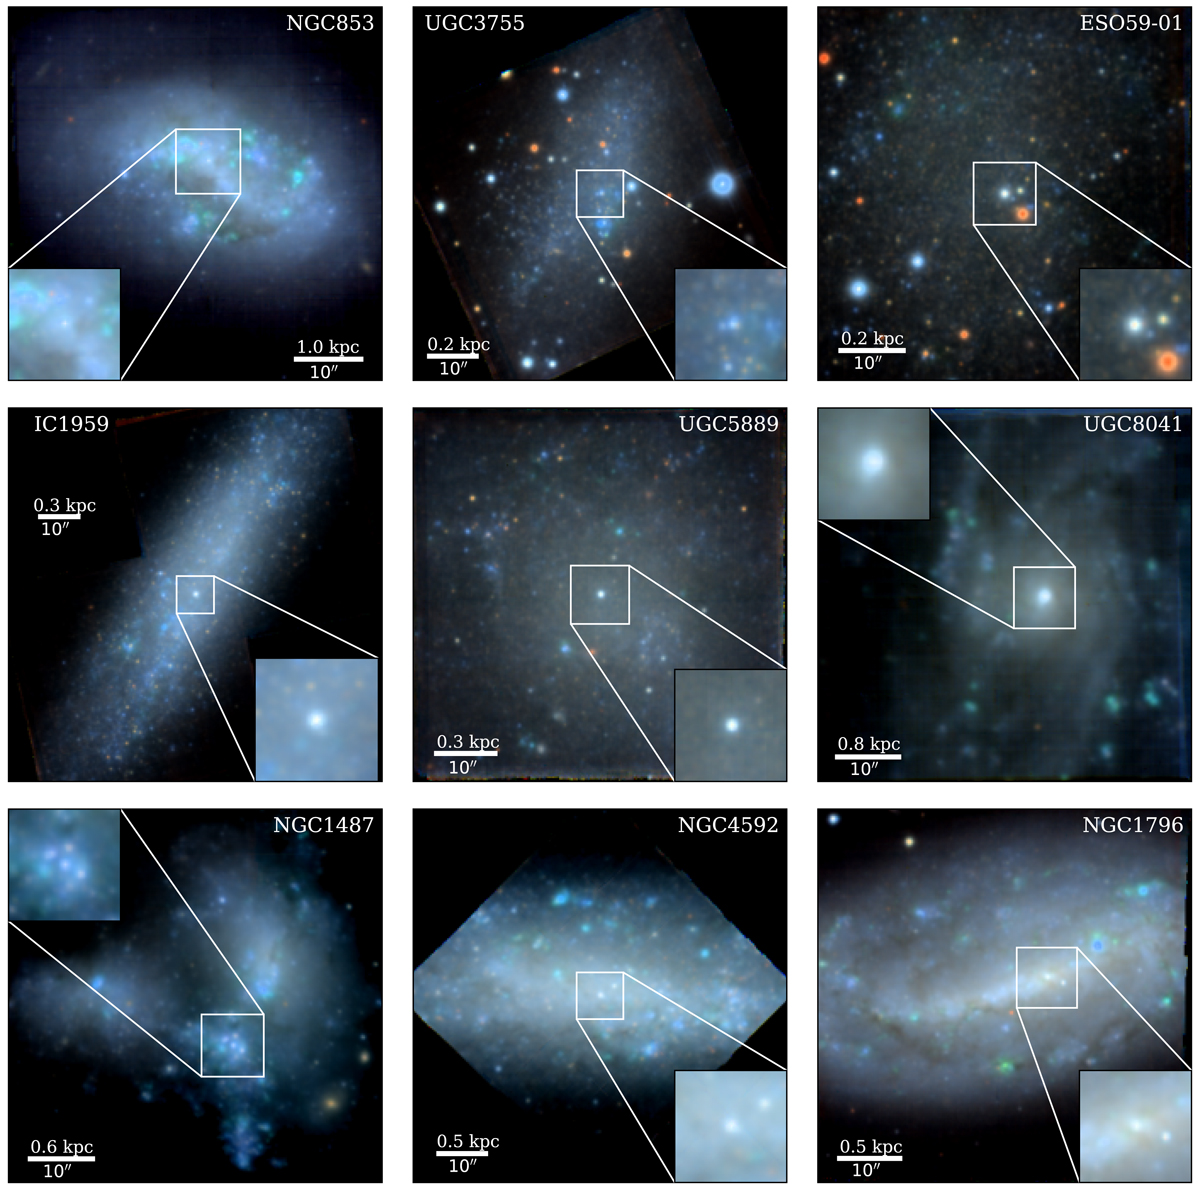
RGB images of the sample galaxies based on synthetic V, I, and R band images obtained from the MUSE cubes. The inset shows a zoom to a 10″ × 10″ region around each NSC. The conversion from arcseconds to kpc is shown in white. North is up, east is to the left.
Current usage metrics show cumulative count of Article Views (full-text article views including HTML views, PDF and ePub downloads, according to the available data) and Abstracts Views on Vision4Press platform.
Data correspond to usage on the plateform after 2015. The current usage metrics is available 48-96 hours after online publication and is updated daily on week days.
Initial download of the metrics may take a while.