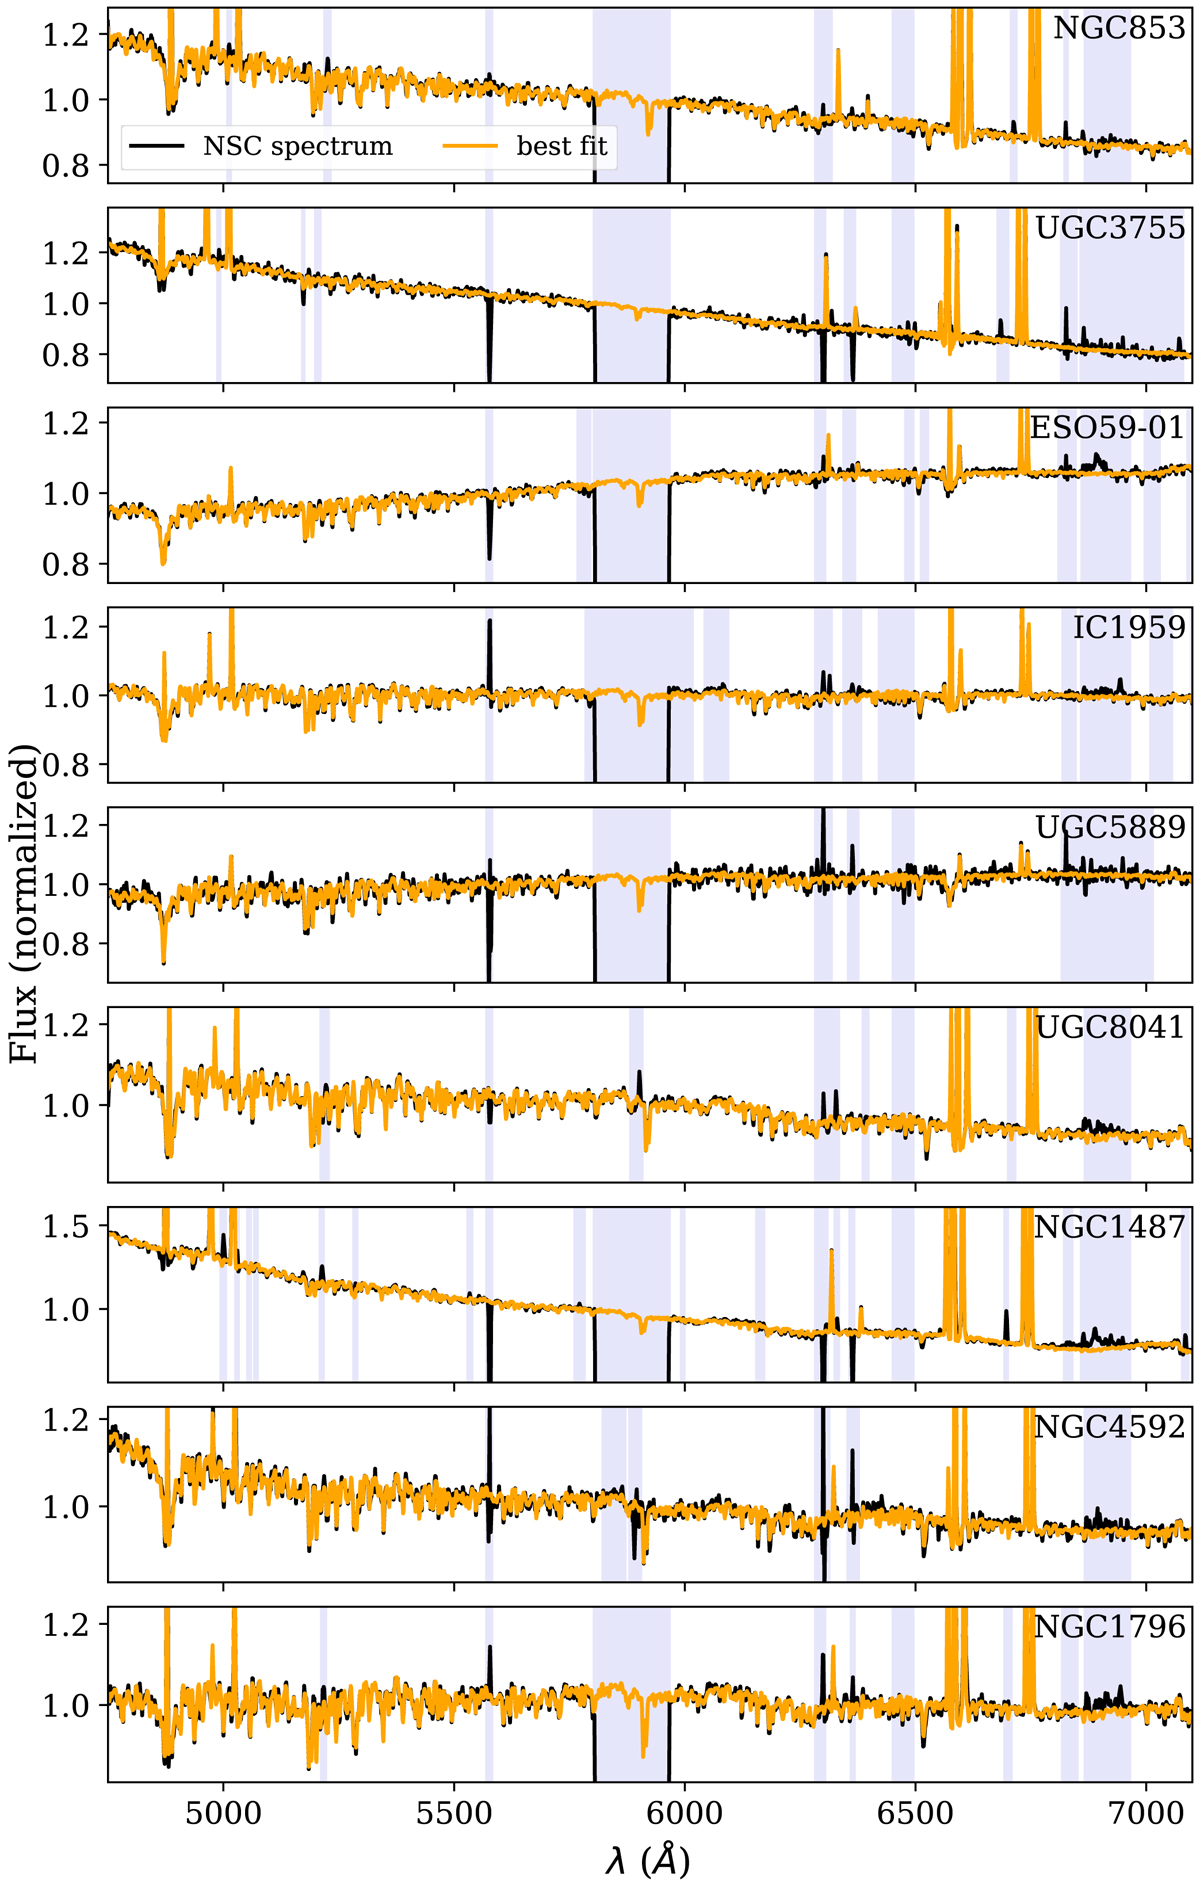
Fig. 2.
Download original image
NSC spectra in black with PPXF fit in orange, showing a fit of both the absorption and emission lines. The light purple regions were masked during the fits. Each panel corresponds to one galaxy. We note that the y-axis scale is not the same in all panels. The range is chosen to highlight the absorption line features. For observations acquired with AO, the region around the Na D line is blocked.
Current usage metrics show cumulative count of Article Views (full-text article views including HTML views, PDF and ePub downloads, according to the available data) and Abstracts Views on Vision4Press platform.
Data correspond to usage on the plateform after 2015. The current usage metrics is available 48-96 hours after online publication and is updated daily on week days.
Initial download of the metrics may take a while.