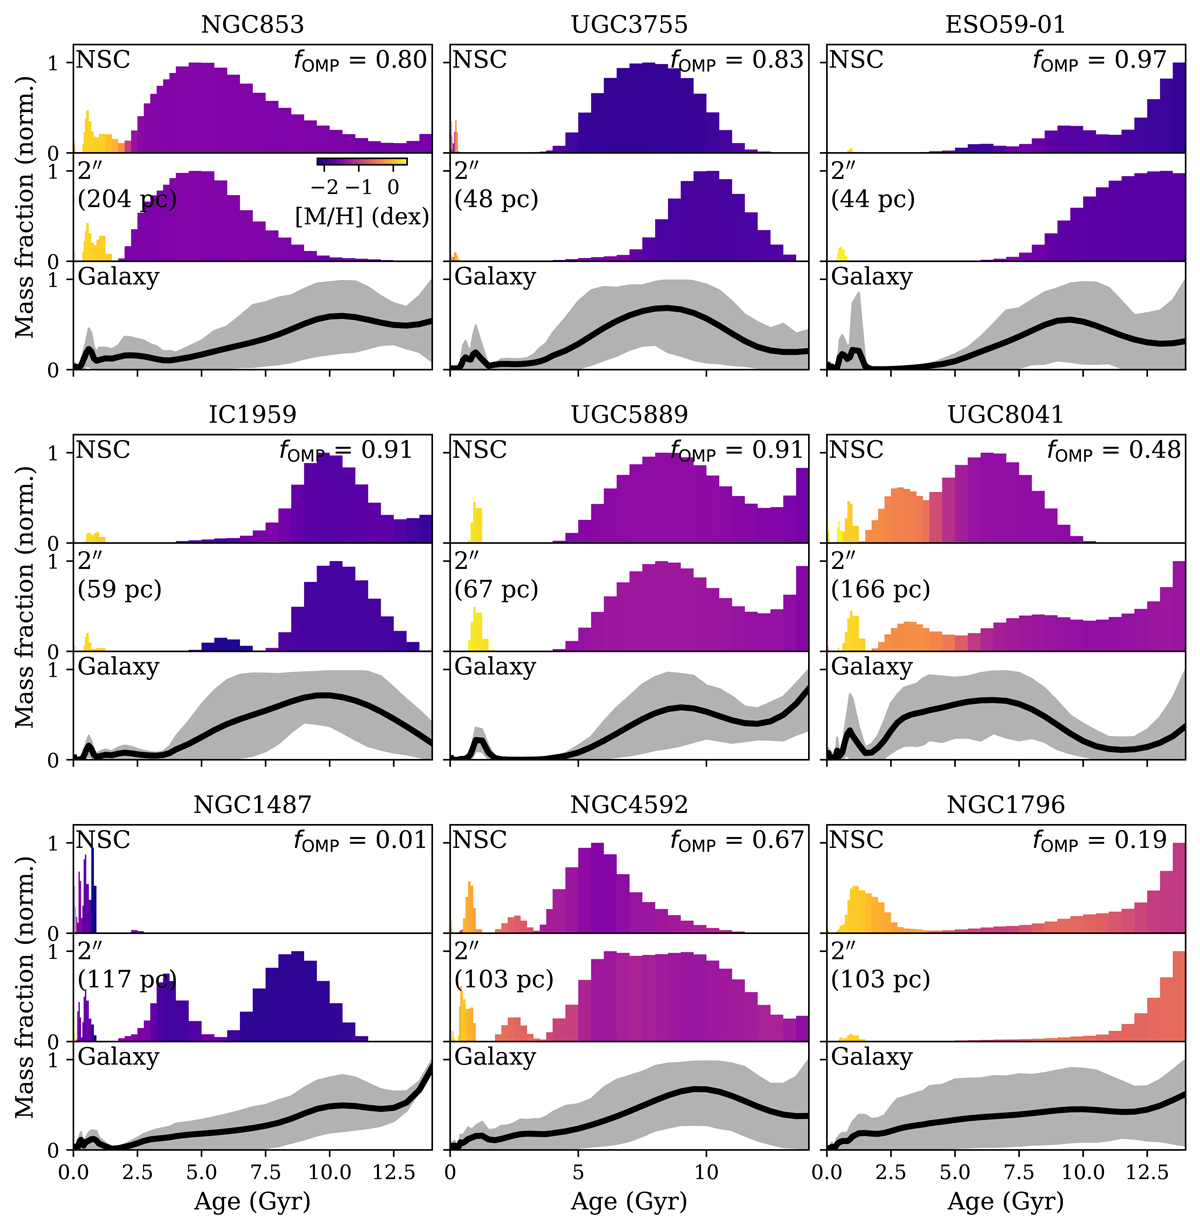
Fig. 4.
Download original image
Star formation histories of the NSCs (top panel of the three panels for each galaxy) from the NSC spectrum, at 2″ radius from the NSC (middle, the circumnuclear region), and the galaxies (bottom, from Voronoi-binned spectra). The mass fractions were normalised such that the maximum is at 1 for visualisation. The NSC and 2″ SFHs are colour-coded by the mean metallicity in each age bin to illustrate the age and metallicity distribution simultaneously. For the galaxies, we show the average SFH from the binned spectra as the thick black line and the 16th and 84th percentiles as grey shaded areas. The galaxies are ordered with increasing galaxy mass from the top left to the bottom right. The mass fraction of old, metal-poor populations (> 2 Gyr, < − 1.0 dex) is indicated in the top right corner of each galaxy.
Current usage metrics show cumulative count of Article Views (full-text article views including HTML views, PDF and ePub downloads, according to the available data) and Abstracts Views on Vision4Press platform.
Data correspond to usage on the plateform after 2015. The current usage metrics is available 48-96 hours after online publication and is updated daily on week days.
Initial download of the metrics may take a while.