Fig. 5.
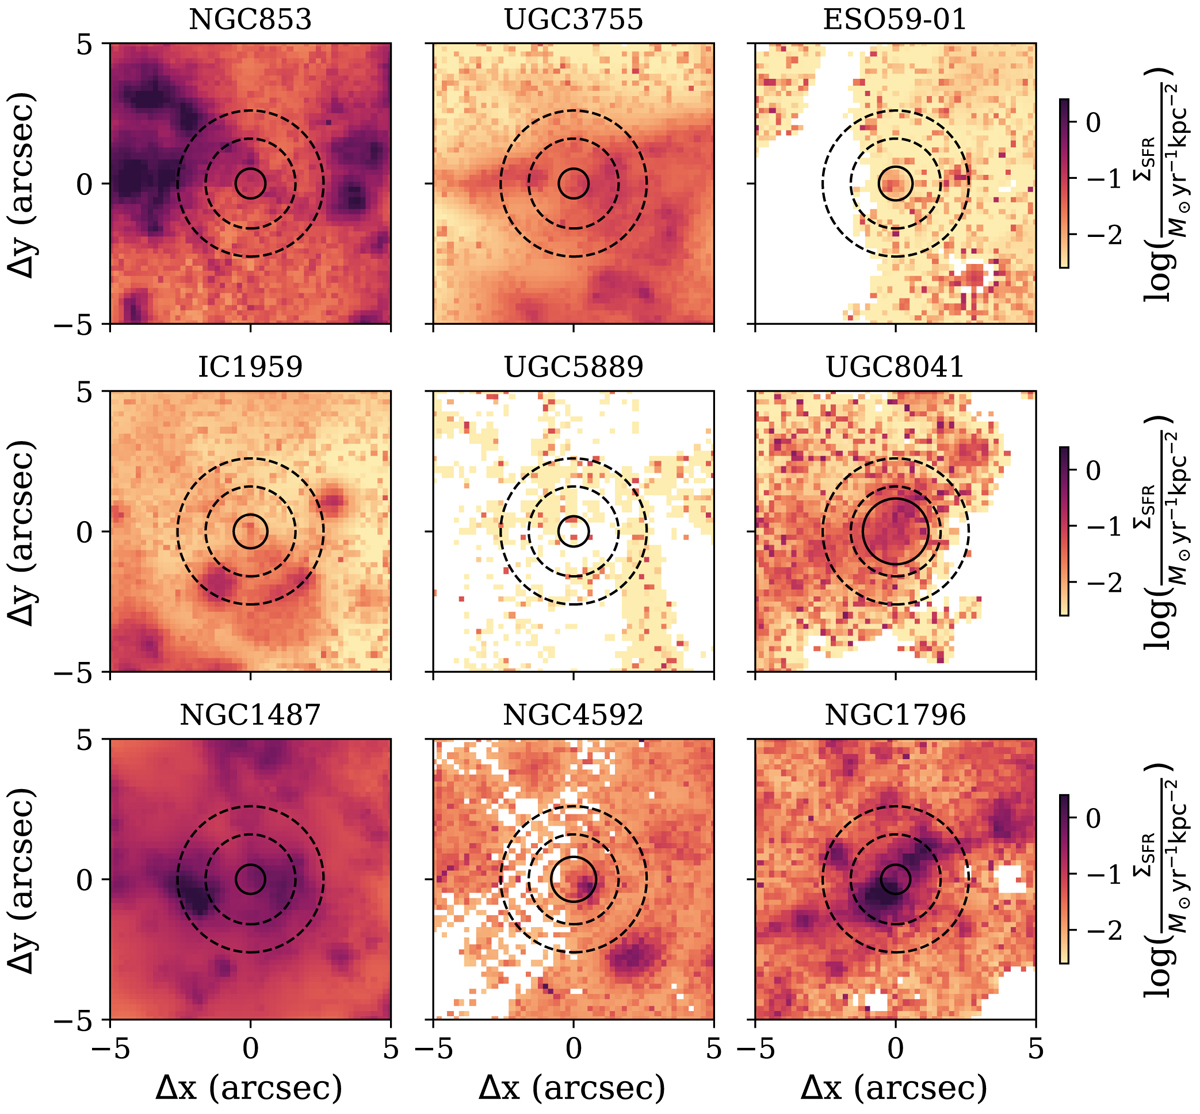
Download original image
Star formation rate surface densities ΣSFR for the different galaxies. Each panel shows the 10″ × 10″ zoom to the region around the NSCs. The positions of the NSCs are highlighted by the circles. Each circle has a radius corresponding to the PSF FWHM. The dashed circles highlight the circumnuclear region at 2″, defined by an annulus with inner radius of 8 pixel = 1.6″ and outer radius of 13 pixel = 2.6″. Regions with low signal-to-noise in the Hα flux were masked.
Current usage metrics show cumulative count of Article Views (full-text article views including HTML views, PDF and ePub downloads, according to the available data) and Abstracts Views on Vision4Press platform.
Data correspond to usage on the plateform after 2015. The current usage metrics is available 48-96 hours after online publication and is updated daily on week days.
Initial download of the metrics may take a while.