Fig. 3
Download original image
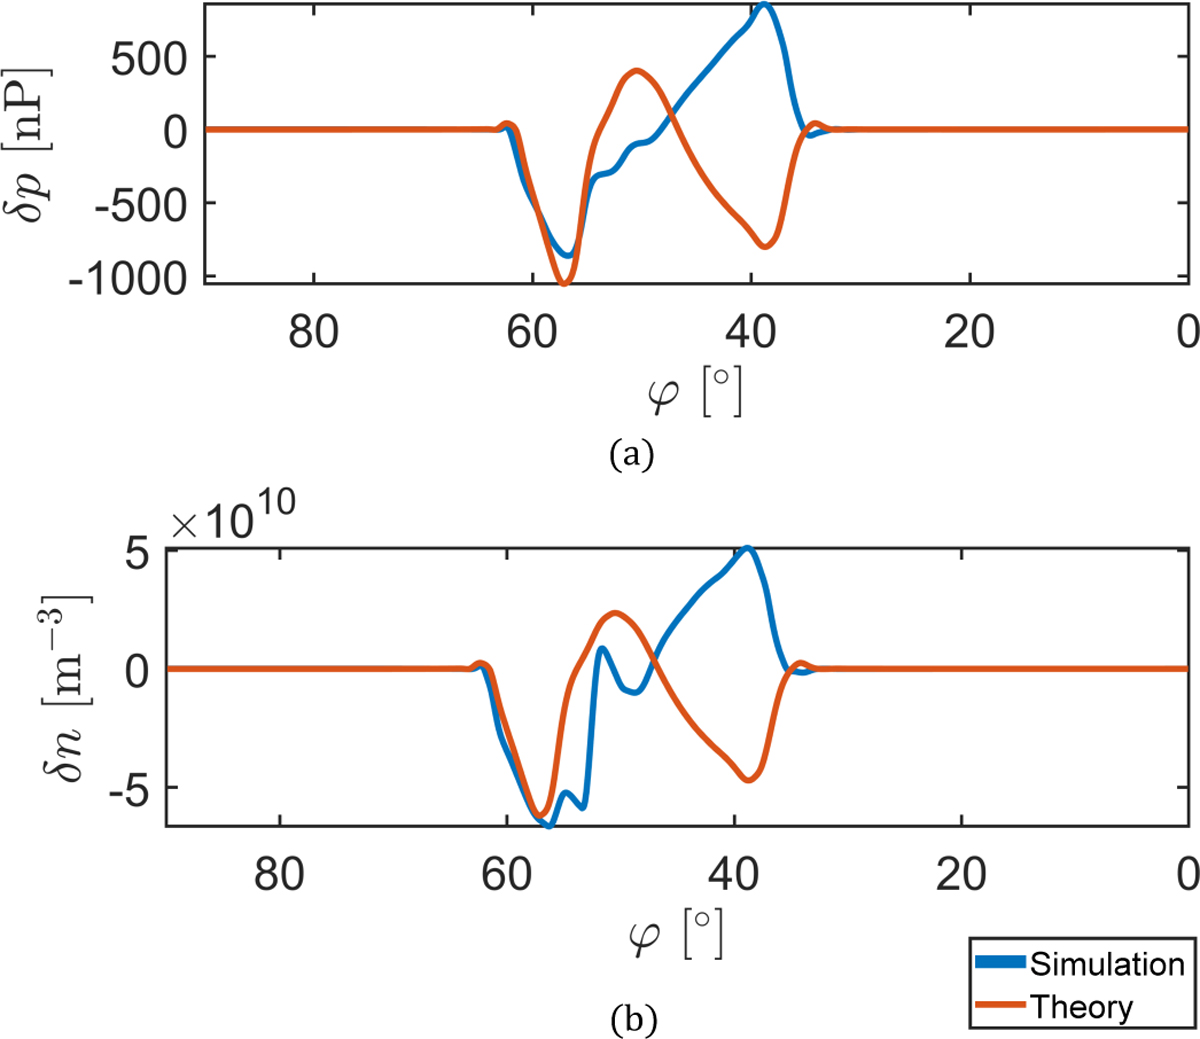
Semi-analytic analysis of the slow mode of TRAPPIST-1 b with line cuts along the azimuthal direction at r = 40 R*. Presented here: pressure perturbation, δp, in panel a and the density perturbation, δρ, in panel b. Blue lines represent simulated values and red lines are semi-analytic expectations based on linear wave theory.
Current usage metrics show cumulative count of Article Views (full-text article views including HTML views, PDF and ePub downloads, according to the available data) and Abstracts Views on Vision4Press platform.
Data correspond to usage on the plateform after 2015. The current usage metrics is available 48-96 hours after online publication and is updated daily on week days.
Initial download of the metrics may take a while.