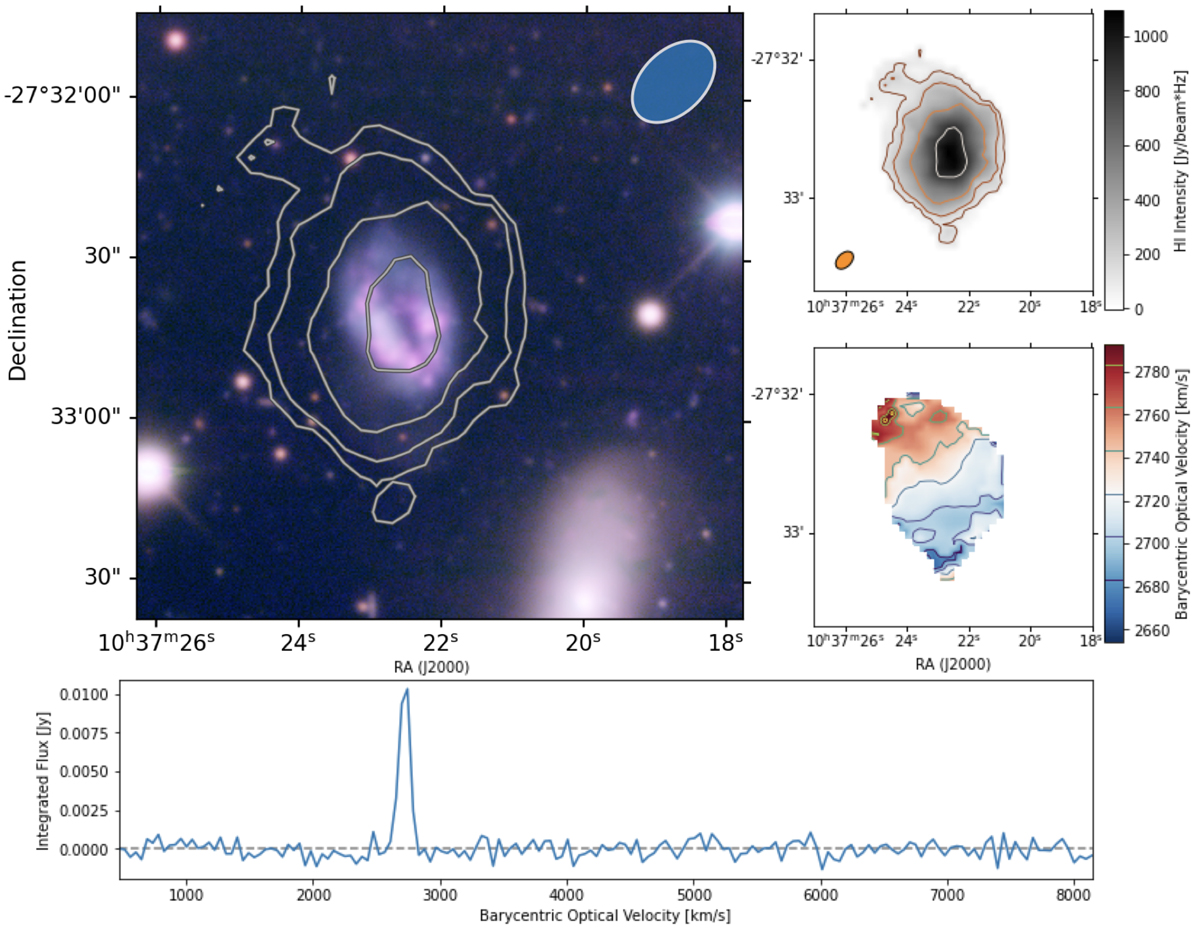
Fig. 4.
Download original image
H I morphology and kinematics of LEDA 753342. Left: DECam false color image with H I total intensity contours at (1.2, 2.4, 4.8, 9.6) × 1020 cm−2 which corresponds to (4, 8, 16, 32) times the rms in a single 44 km s−1 channel. North is up and east is left, parallel to the figure axes. MeerKAT beam is the ellipse in the top right. Top right: H I total intensity gray scale. Middle right: H I intensity-weighted velocity map. Bottom: integrated H I profile.
Current usage metrics show cumulative count of Article Views (full-text article views including HTML views, PDF and ePub downloads, according to the available data) and Abstracts Views on Vision4Press platform.
Data correspond to usage on the plateform after 2015. The current usage metrics is available 48-96 hours after online publication and is updated daily on week days.
Initial download of the metrics may take a while.