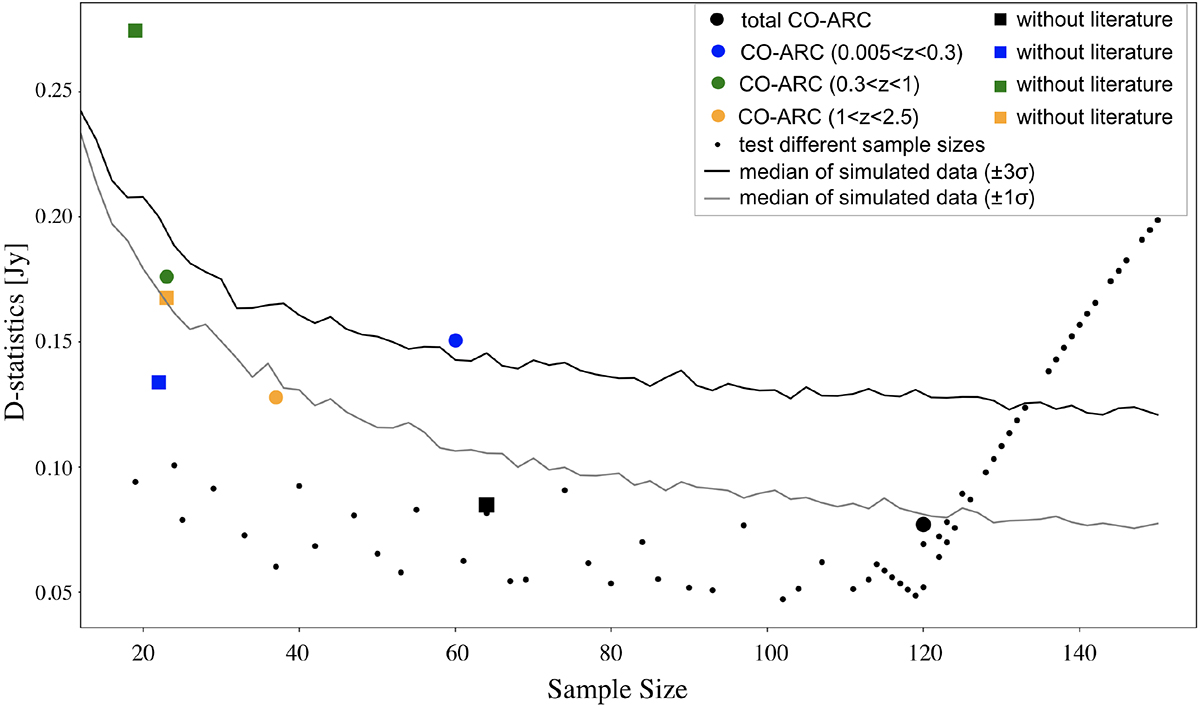
Fig. 1.
Download original image
D-statistic, i.e., maximum distance between two cumulative distributions used for the sample selection versus the sample size. Solid lines show a theoretical comparison of the NVSS and a shuffled NVSS samples with 10 and 30% flux variations. Small black dots show how the sample D-statistic changes as a function of the number of bootstrapped sources (see text). The large circles show the final numbers for the CO-ARC (black) and for individual z ranges (color). The same analysis is shown for the CO-ARC only using the ALMA calibrators (without including the literature sources) is indicated as squares and equivalent color code for the redshift bin. We reach an optimal sample size of 120 (CO-ARC in black circle) for a D-statistics smaller than 10% and converging with the values computed to the theoretical shuffled NVSS sample down to 10% flux variation.
Current usage metrics show cumulative count of Article Views (full-text article views including HTML views, PDF and ePub downloads, according to the available data) and Abstracts Views on Vision4Press platform.
Data correspond to usage on the plateform after 2015. The current usage metrics is available 48-96 hours after online publication and is updated daily on week days.
Initial download of the metrics may take a while.