Open Access
Fig. 4.
Download original image
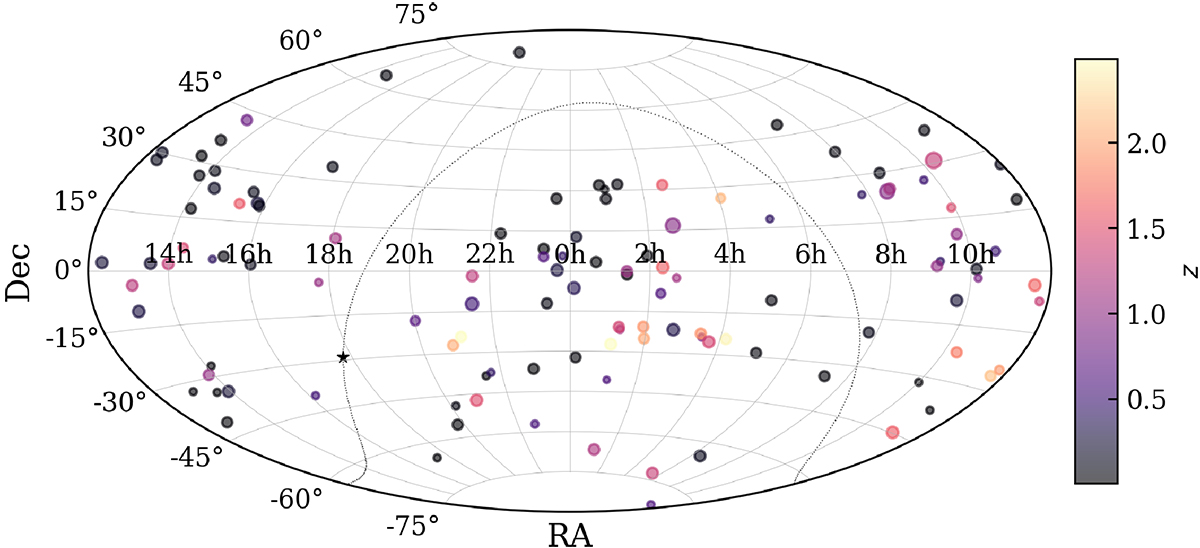
Distribution of the sample in the sky in the aitoff projection. The color code corresponds to the redshift and the sizes are according to the FWHP of the primary beam of the observations. The dotted curve and the star indicate the Galactic plane and center.
Current usage metrics show cumulative count of Article Views (full-text article views including HTML views, PDF and ePub downloads, according to the available data) and Abstracts Views on Vision4Press platform.
Data correspond to usage on the plateform after 2015. The current usage metrics is available 48-96 hours after online publication and is updated daily on week days.
Initial download of the metrics may take a while.