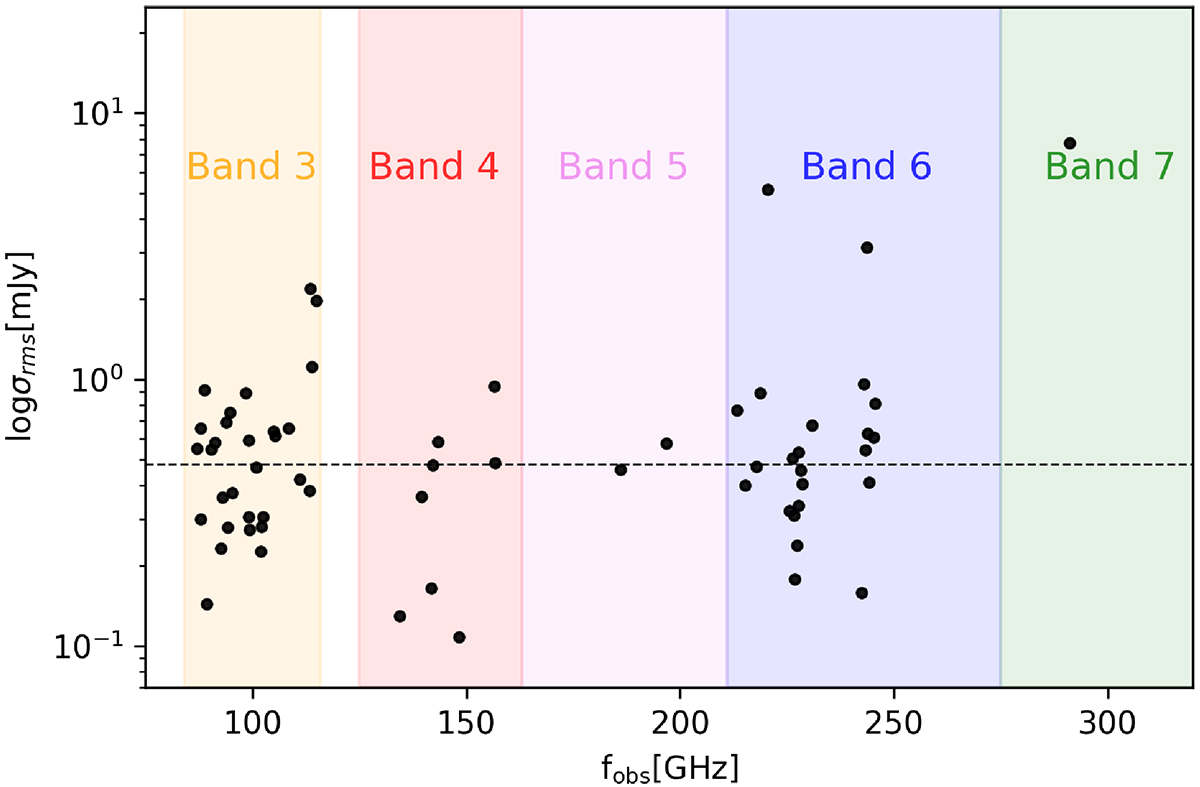
Fig. 5.
Download original image
Distribution of achieved rms sensitivities per ALMA band. The black circles represent the rms noise levels (in log scale and mJy units) achieve for the emission line datacubes of the ALMA calibrators sample in function of the respective observed frequencies (in GHz) or ALMA bands highlighted in colors. The dashed line indicates the median value of 0.482 mJy for the 66 sources drawn from the CO-ARC.
Current usage metrics show cumulative count of Article Views (full-text article views including HTML views, PDF and ePub downloads, according to the available data) and Abstracts Views on Vision4Press platform.
Data correspond to usage on the plateform after 2015. The current usage metrics is available 48-96 hours after online publication and is updated daily on week days.
Initial download of the metrics may take a while.