Fig. 6
Download original image
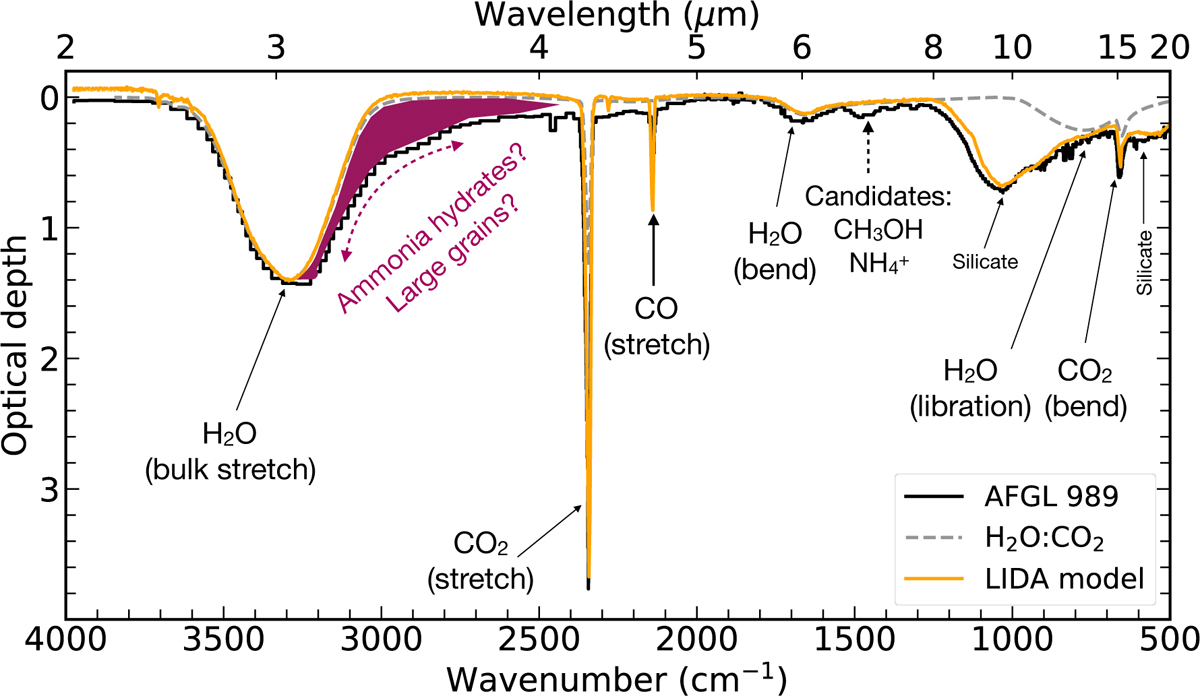
AFGL 989 vs. LIDA model. LIDA model using the SPECFY online tool (orange) superposed to the ISO spectrum of the protostar AFGL 989 (black) in the optical depth scale taken from Gibb et al. (2004). The synthetic spectrum in the optical depth scale is composed of the linear combination of three ice spectra (pure H2O, H2O:CO2 (10:1), and CO:CO2 (2:1)) and silicate template from the GCS 3 source. The dominant ice spectrum is H2O:CO2 (10:1), shown by the gray dashed line. The assignments of a few bands are indicated. The red hatched area highlights an infrared absorption excess attributed to ammonia hydrates and large grains (see text).
Current usage metrics show cumulative count of Article Views (full-text article views including HTML views, PDF and ePub downloads, according to the available data) and Abstracts Views on Vision4Press platform.
Data correspond to usage on the plateform after 2015. The current usage metrics is available 48-96 hours after online publication and is updated daily on week days.
Initial download of the metrics may take a while.