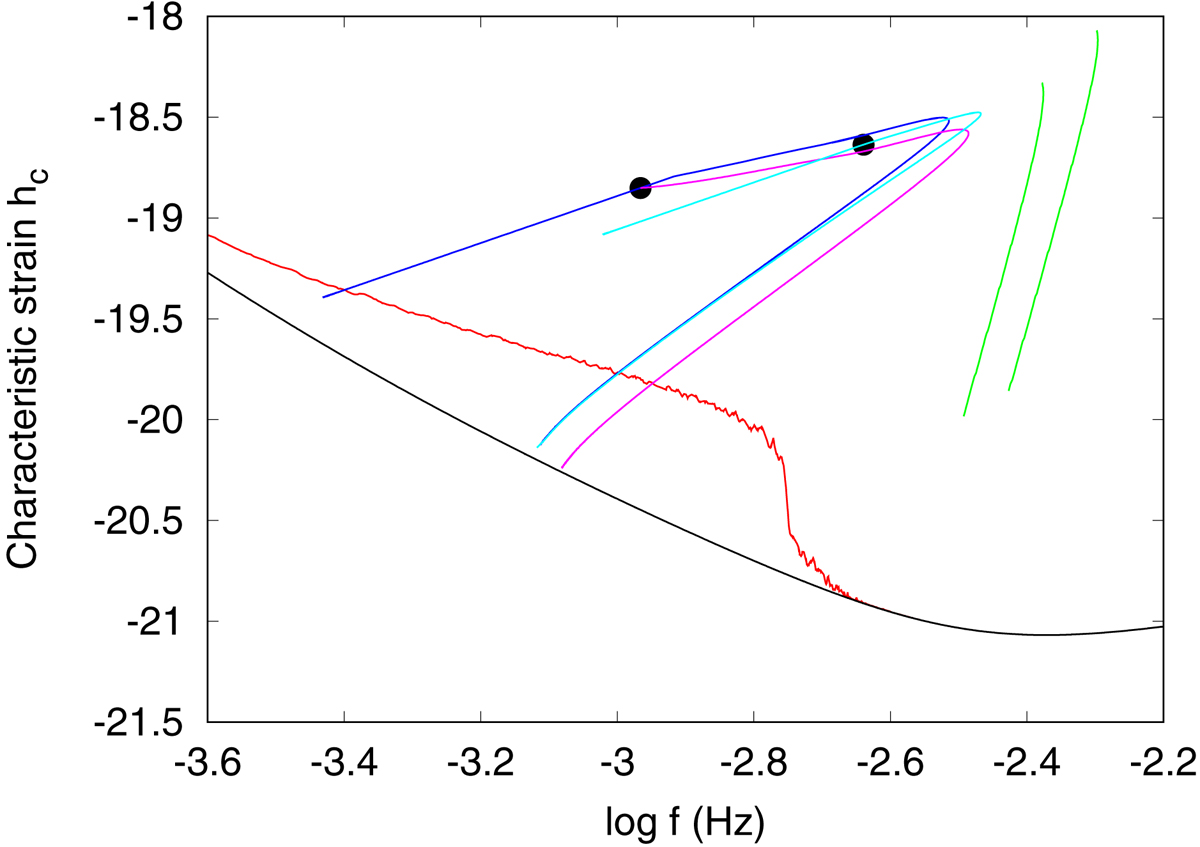
Fig. 4.
Download original image
Comparison of the tracks computed in the present study and the tracks computed using M − R relations, as in Nelemans et al. (2001a). The blue line represents the track for (MHe, 0 + MWD, 0, P0) = (0.43+0.87) M⊙, 90 min; the magenta line is the part of the track for the same system under the assumption of non-conservative mass exchange; and the cyan line represents the track for (MHe, 0 + MWD, 0, P0) = (0.33+0.72) M⊙, 35 min. Black dots mark RLOF. Green lines indicate the tracks computed using analytic M − R relations for the systems (MHe, 0 + MWD, 0, P0) = (0.33+0.72) M⊙, 35 min and (MHe, 0 + MWD, 0, P0) = (0.43+0.87) M⊙, 90 min (left to right, respectively). The black line is the LISA noise line, and the red line indicates the gravitational waves’ foreground+LISA noise.
Current usage metrics show cumulative count of Article Views (full-text article views including HTML views, PDF and ePub downloads, according to the available data) and Abstracts Views on Vision4Press platform.
Data correspond to usage on the plateform after 2015. The current usage metrics is available 48-96 hours after online publication and is updated daily on week days.
Initial download of the metrics may take a while.