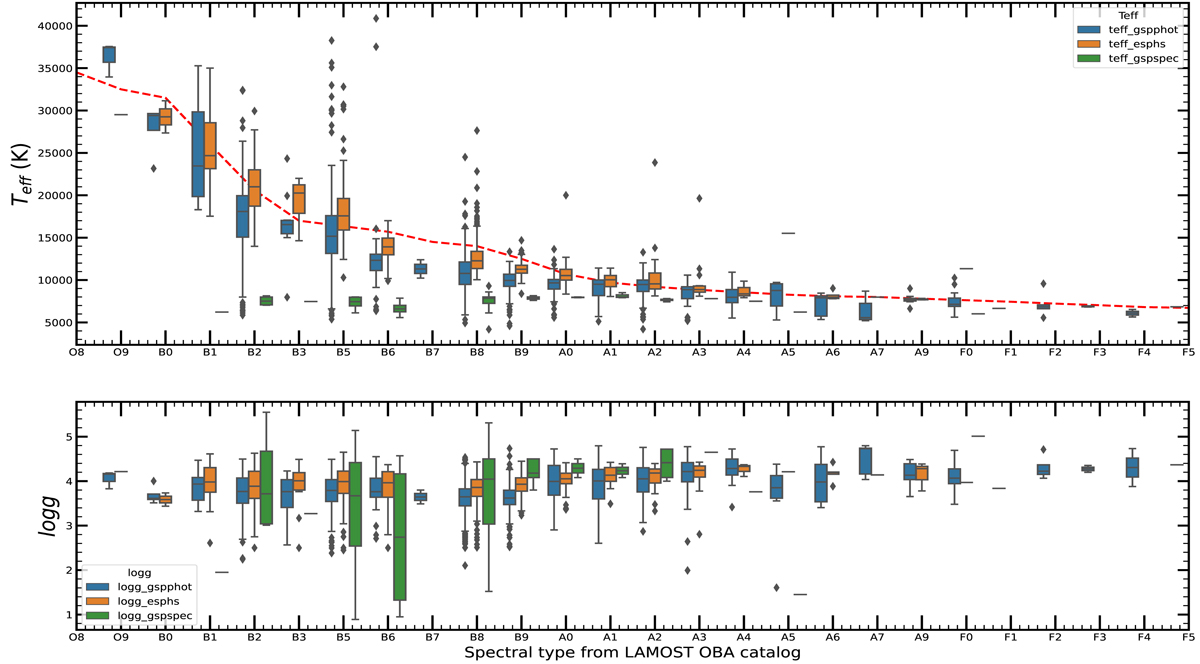
Fig. 2.
Download original image
Boxplot representation of comparison between stellar parameters provided by Gaia DR3 and spectral type from LEMC. Top: The distribution between different Teff values provided by Gaia DR3 and the spectral type estimated in LEMC. The red dashed line represents the Teff versus spectral type calibration relation from Pecaut & Mamajek (2013). Bottom: The distribution between log g values of stars from Gaia DR3 and the spectral type estimated in LEMC.
Current usage metrics show cumulative count of Article Views (full-text article views including HTML views, PDF and ePub downloads, according to the available data) and Abstracts Views on Vision4Press platform.
Data correspond to usage on the plateform after 2015. The current usage metrics is available 48-96 hours after online publication and is updated daily on week days.
Initial download of the metrics may take a while.