Fig. 3.
Download original image
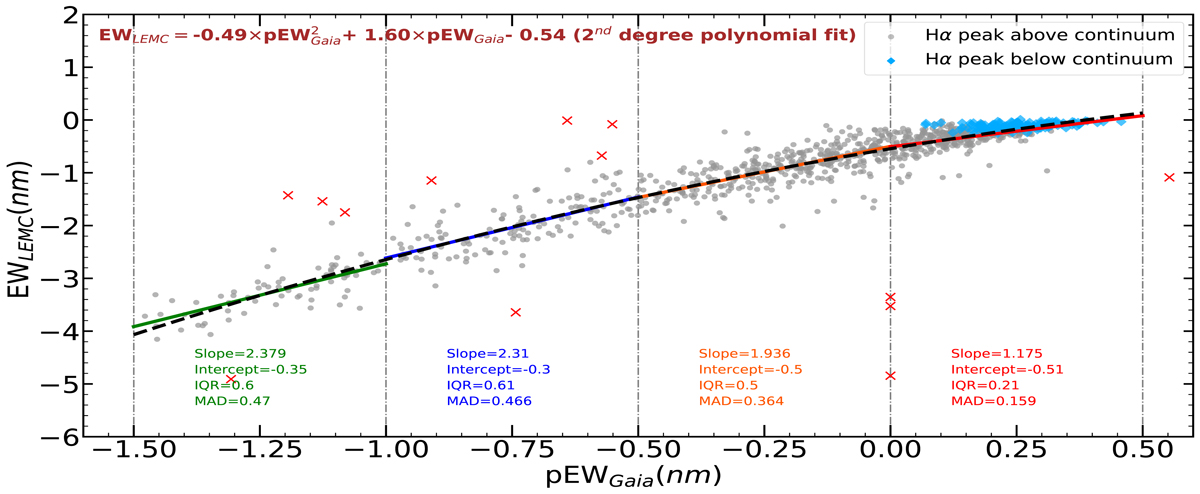
Scatter plot between the pEW provided by Gaia DR3 and the EW estimated for LEMC CBe stars. The red crosses shows the outliers based on a normal distribution analysis. The grey filled circles show the stars with a Hα peak above the continuum and light blue diamonds with a Hα peak below the continuum. A global second degree polynomial fit is shown in black dashed lines along with the equation at the top left of the plot. Further, the piecewise fit within each interval is shown along with the fit parameters in corresponding colours. Negative EW values denote lines in emission.
Current usage metrics show cumulative count of Article Views (full-text article views including HTML views, PDF and ePub downloads, according to the available data) and Abstracts Views on Vision4Press platform.
Data correspond to usage on the plateform after 2015. The current usage metrics is available 48-96 hours after online publication and is updated daily on week days.
Initial download of the metrics may take a while.