Fig. 4.
Download original image
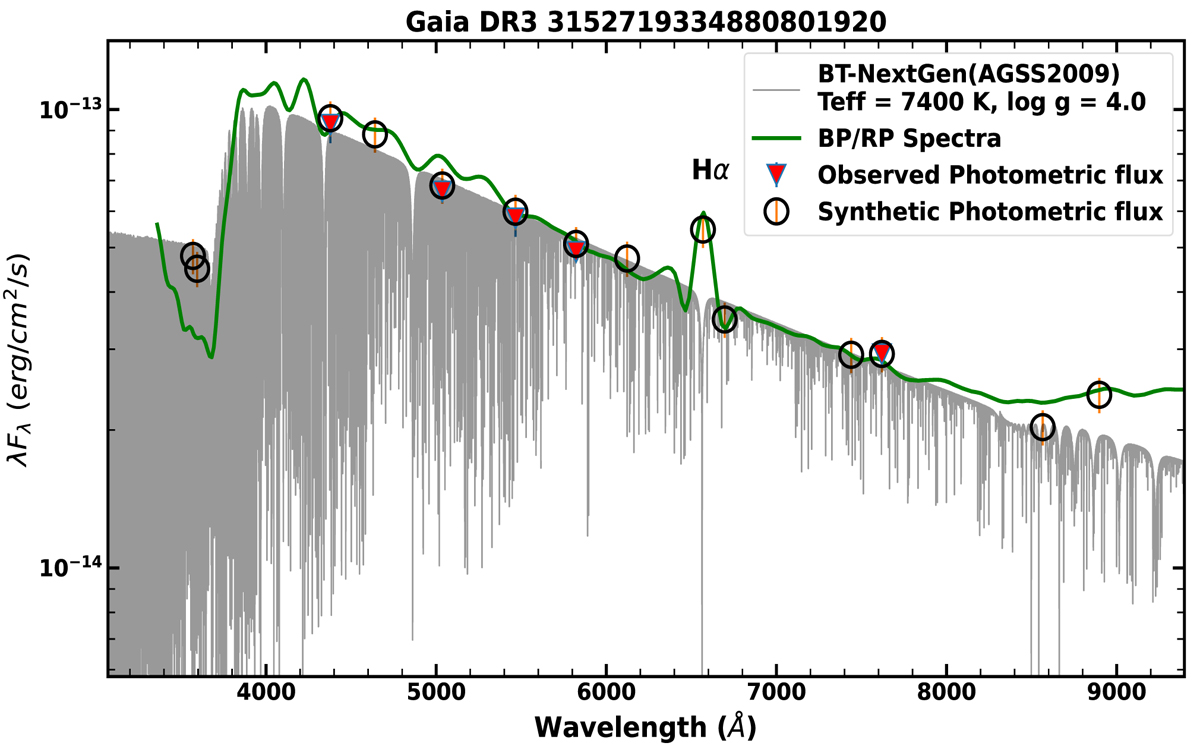
Spectral energy distribution of Gaia DR3 3152719334880801920 with λFλ in the y axis and the wavelength in the x axis. Red triangles denote the photometric flux available pre-Gaia DR3. Black hollow circles represent the synthetic photometry calculated using the Gaia BP/RP continuous spectrum. Gaia DR3 mean sampled BP/RP spectrum is shown with a green solid line. The best fit BT-NextGen spectrum is shown in grey.
Current usage metrics show cumulative count of Article Views (full-text article views including HTML views, PDF and ePub downloads, according to the available data) and Abstracts Views on Vision4Press platform.
Data correspond to usage on the plateform after 2015. The current usage metrics is available 48-96 hours after online publication and is updated daily on week days.
Initial download of the metrics may take a while.