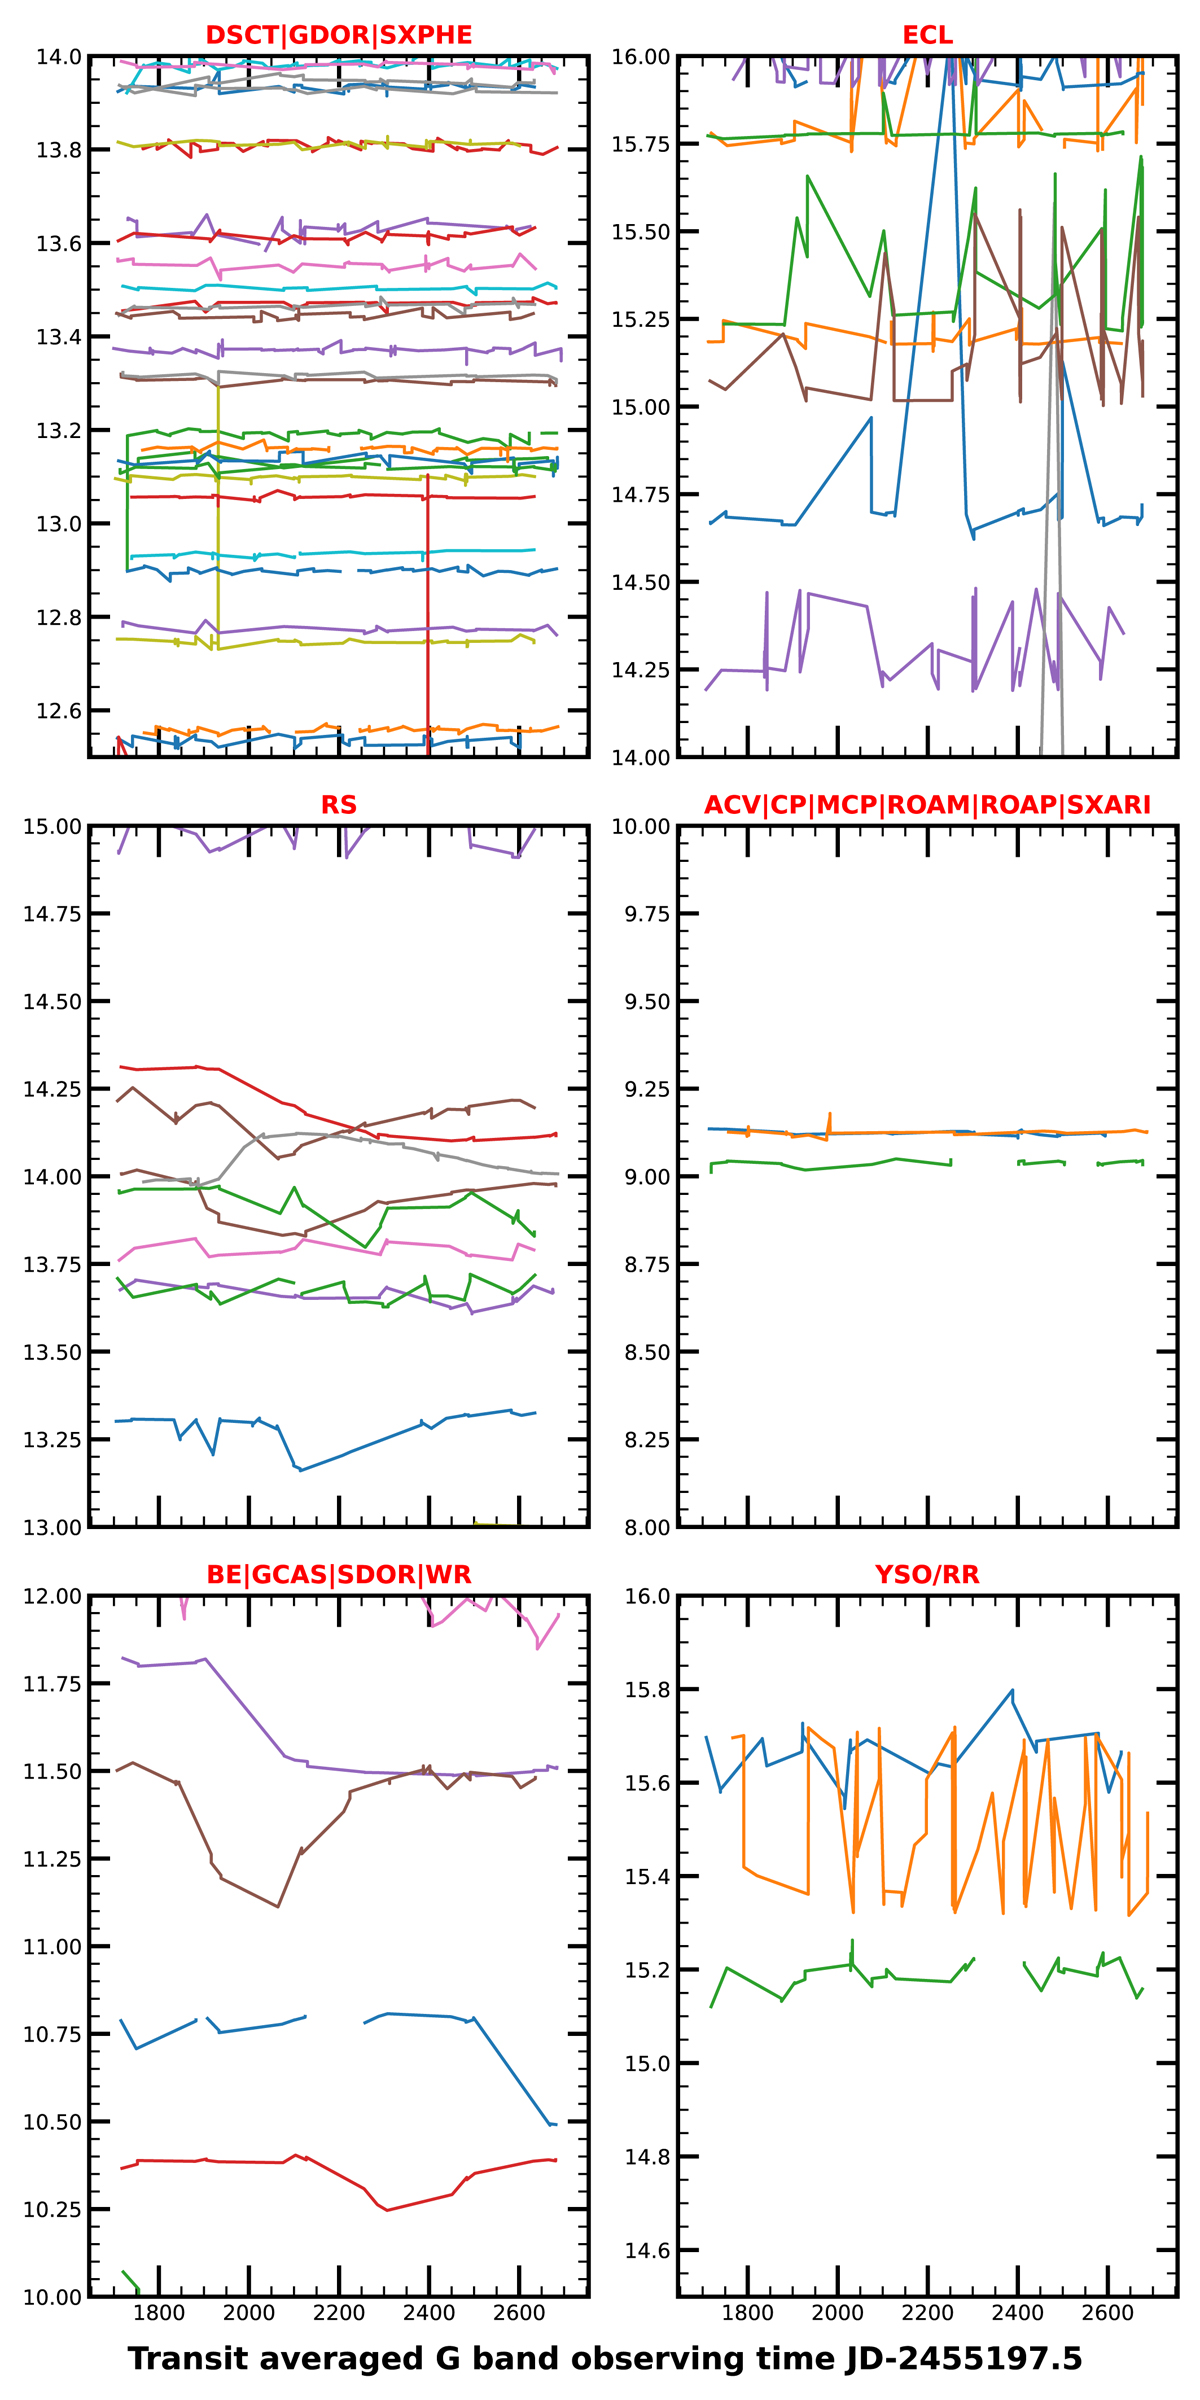
Fig. 5.
Download original image
G-band multi-epoch photometry of stars classified as variables. The different subplots show the different variable classes as provided by Gaia DR3 with the class specification shown in red letters. The y axis is limited to a range of two mag to visualise the variability in each class. The description on each variable class is provided in Table 2 of Eyer et al. (2022).
Current usage metrics show cumulative count of Article Views (full-text article views including HTML views, PDF and ePub downloads, according to the available data) and Abstracts Views on Vision4Press platform.
Data correspond to usage on the plateform after 2015. The current usage metrics is available 48-96 hours after online publication and is updated daily on week days.
Initial download of the metrics may take a while.