Fig. 6
Download original image
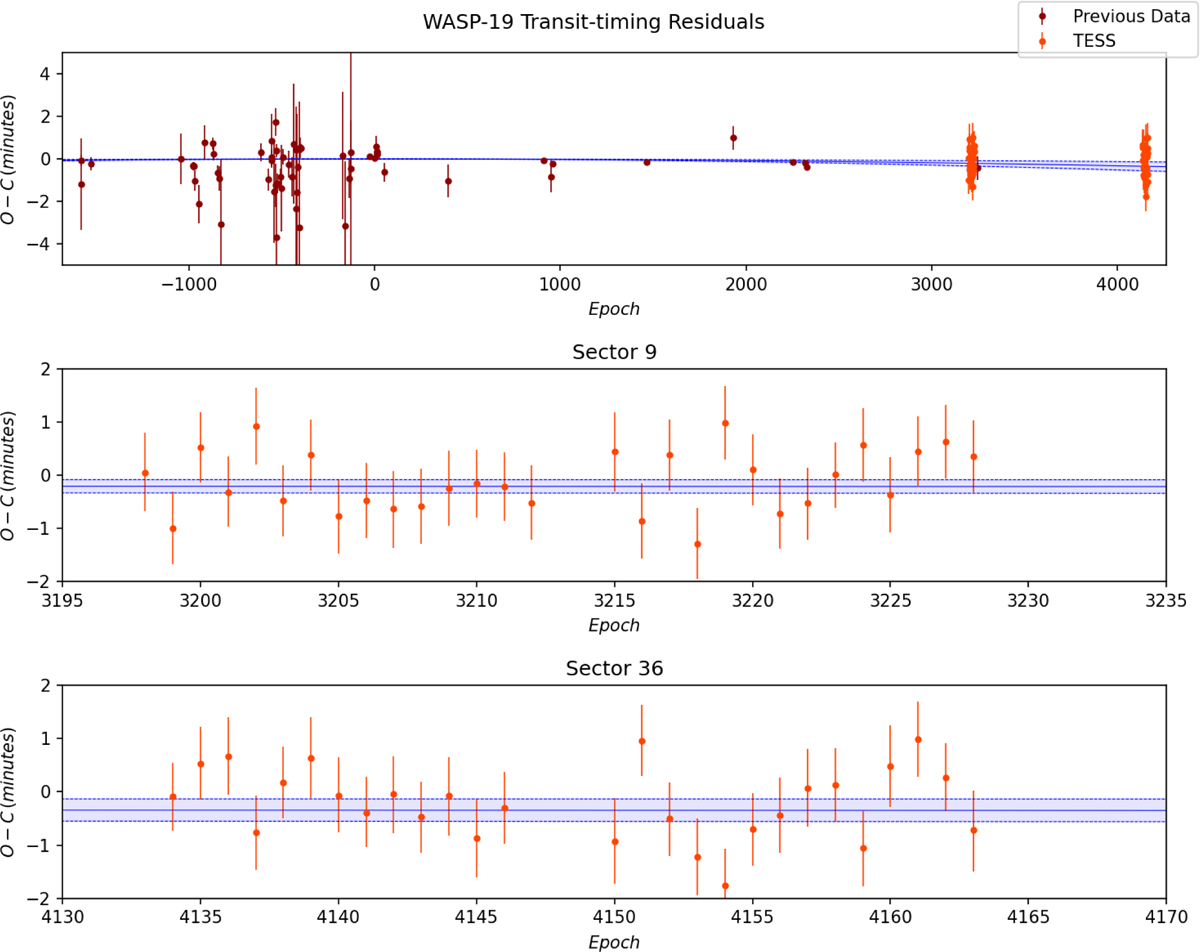
Same as Fig. 5, but for WASP-19b. The points from previous data are plotted in dark red and listed with references in Table A.2. As with WASP-18b, we did not find any additional signals in the residuals, with most being compatible with zero at 1σ. Upper plot: complete view of all the transits used in the fit. Middle plot: zoom of the transit timings of TESS Sector 9. Bottom plot: zoom of the transit timings of TESS Sector 36.
Current usage metrics show cumulative count of Article Views (full-text article views including HTML views, PDF and ePub downloads, according to the available data) and Abstracts Views on Vision4Press platform.
Data correspond to usage on the plateform after 2015. The current usage metrics is available 48-96 hours after online publication and is updated daily on week days.
Initial download of the metrics may take a while.