Fig. 5
Download original image
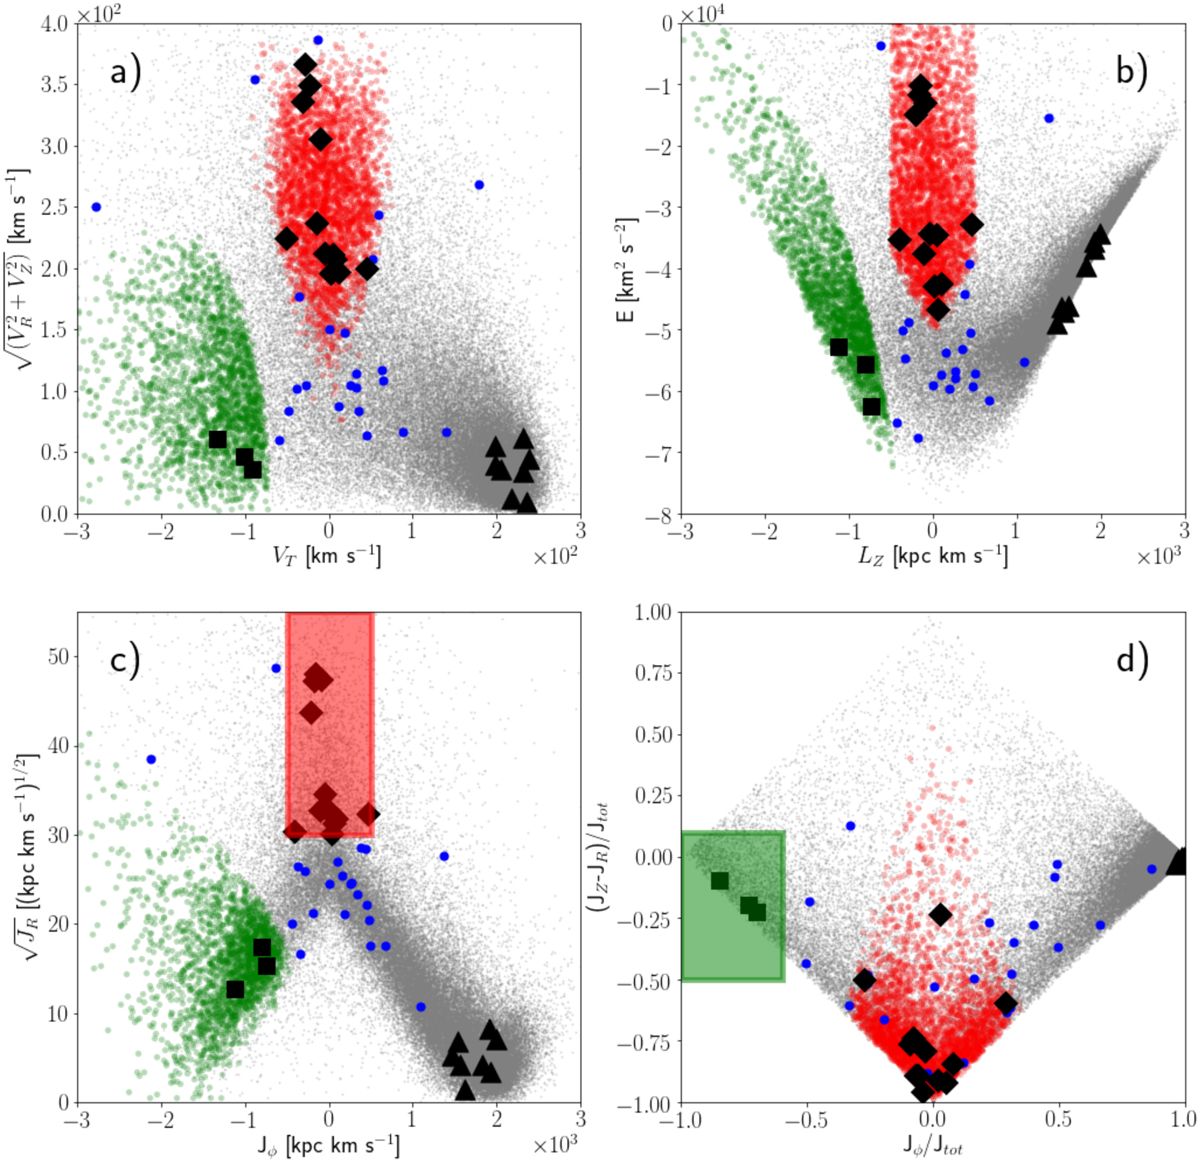
Target stars kinematic properties are presented in various planes. Program stars are presented as big filled symbols. The background population (gray points) is the “good parallax sample” of Bonifacio et al. (2021 ) for reference. Red filled points in all planes are stars selected from the background population as likely GSE members according to the red shaded box of panel c. Green filled points are likely Sequoia members according to the green shaded box in panel d. Panel a: Toomre diagram (![]() versus VT). Panel b: orbital energy E versus angular momentum, LZ. Panel d (action diamond diagram): the difference in the vertical and radial actions (Jz − Jr) versus the azimuthal action (Jϕ = LZ). Quantities are normalised to the total action Jtot = JZ + JR + |Jϕ|. Panel c:
versus VT). Panel b: orbital energy E versus angular momentum, LZ. Panel d (action diamond diagram): the difference in the vertical and radial actions (Jz − Jr) versus the azimuthal action (Jϕ = LZ). Quantities are normalised to the total action Jtot = JZ + JR + |Jϕ|. Panel c: ![]() versus LZ. Target stars likely belonging to GSE and Sequoia are marked as black-filled diamond and squares, respectively. Targets likely belonging to the thin disc are presented as black filled triangles. The remaining targets are presented as blue filled circles.
versus LZ. Target stars likely belonging to GSE and Sequoia are marked as black-filled diamond and squares, respectively. Targets likely belonging to the thin disc are presented as black filled triangles. The remaining targets are presented as blue filled circles.
Current usage metrics show cumulative count of Article Views (full-text article views including HTML views, PDF and ePub downloads, according to the available data) and Abstracts Views on Vision4Press platform.
Data correspond to usage on the plateform after 2015. The current usage metrics is available 48-96 hours after online publication and is updated daily on week days.
Initial download of the metrics may take a while.