Fig. 6
Download original image
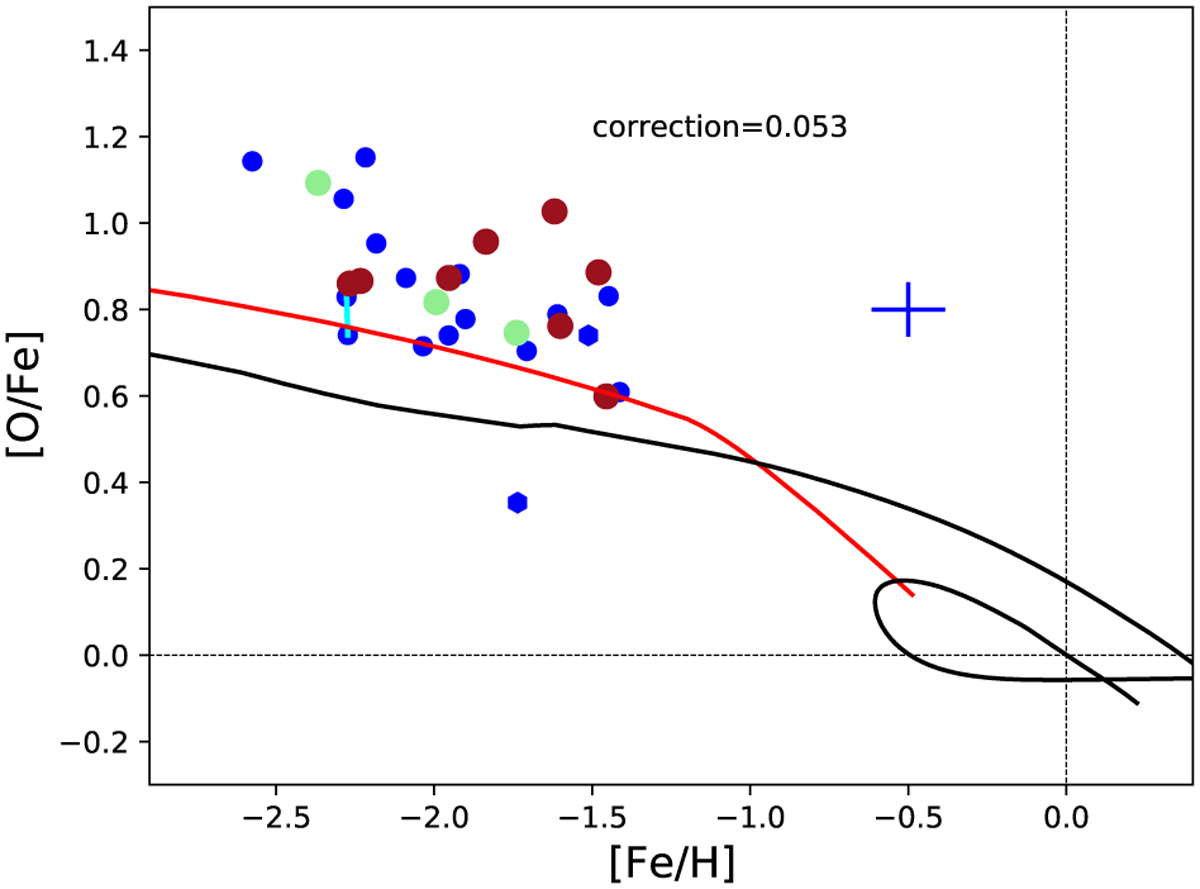
[O/Fe] versus [Fe/H] abundances measured in the MINCE stars: blue solid dots stars selected with the mince2 selection, hexagons from APOGEE. Cyan lines connect the abundances measured for the same stars with spectra taken from two facilities. The colours of the dot refer to the substructures to which they belong: red for GSE, light green for Sequoia and blue for the remaining stars. The mean errors of the MINCE sample are reported as blue cross. The black lines refers to the chemical evolution model by Spitoni et al. (2021) for the discs of our Galaxy, whereas the red line is a model for GSE (Cescutti et al. 2020). Correction refers to the offset in [O/Fe] applied to the models (see Sect. 7.1 for details).
Current usage metrics show cumulative count of Article Views (full-text article views including HTML views, PDF and ePub downloads, according to the available data) and Abstracts Views on Vision4Press platform.
Data correspond to usage on the plateform after 2015. The current usage metrics is available 48-96 hours after online publication and is updated daily on week days.
Initial download of the metrics may take a while.