Fig. 4
Download original image
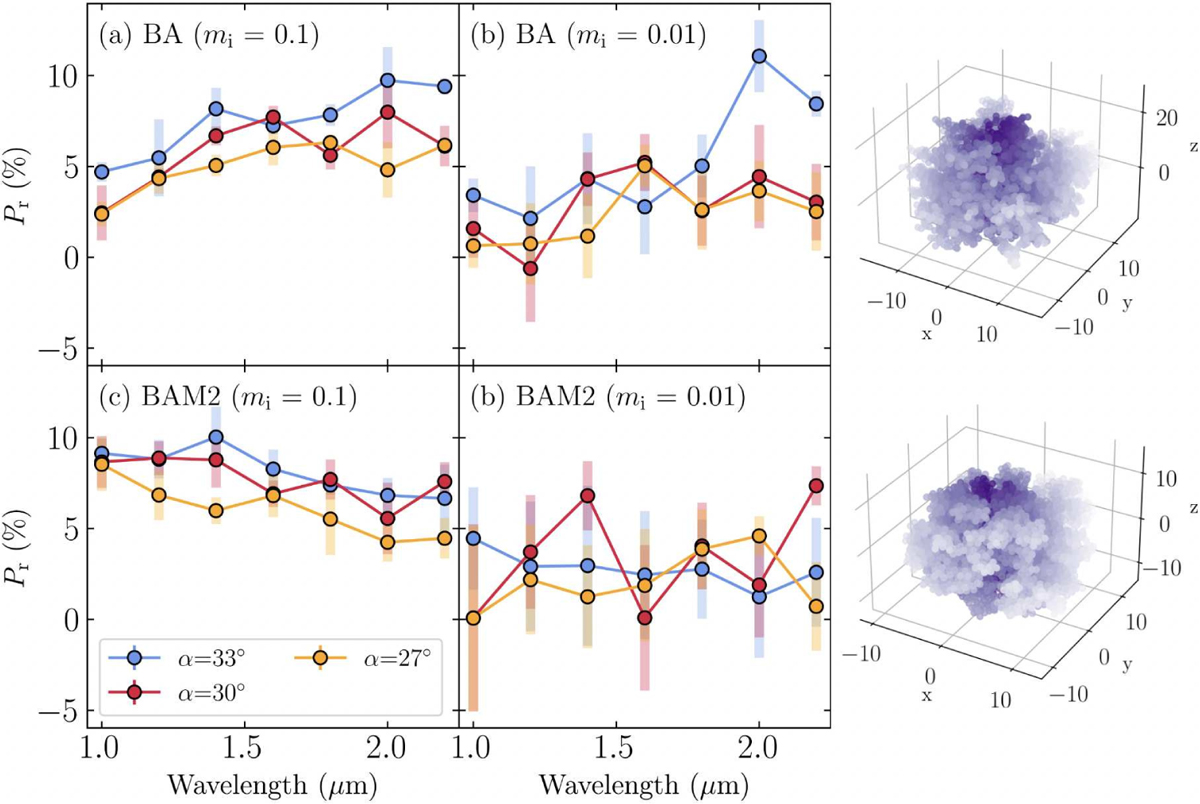
Orientation- and realization-averaged Pr as a function of wavelength. The upper and lower rows show results for BA and BAM2, respectively, whose geometry is visualized on the rightmost side of the micrometer scale. The left columns display outputs in the standard composition (mr = 1.6 and mi = 0.1), while the right columns show those with a lower absorptivity (mi = 0.01). Errors indicate 1σ for the four realizations of the clusters.
Current usage metrics show cumulative count of Article Views (full-text article views including HTML views, PDF and ePub downloads, according to the available data) and Abstracts Views on Vision4Press platform.
Data correspond to usage on the plateform after 2015. The current usage metrics is available 48-96 hours after online publication and is updated daily on week days.
Initial download of the metrics may take a while.