Fig. 5
Download original image
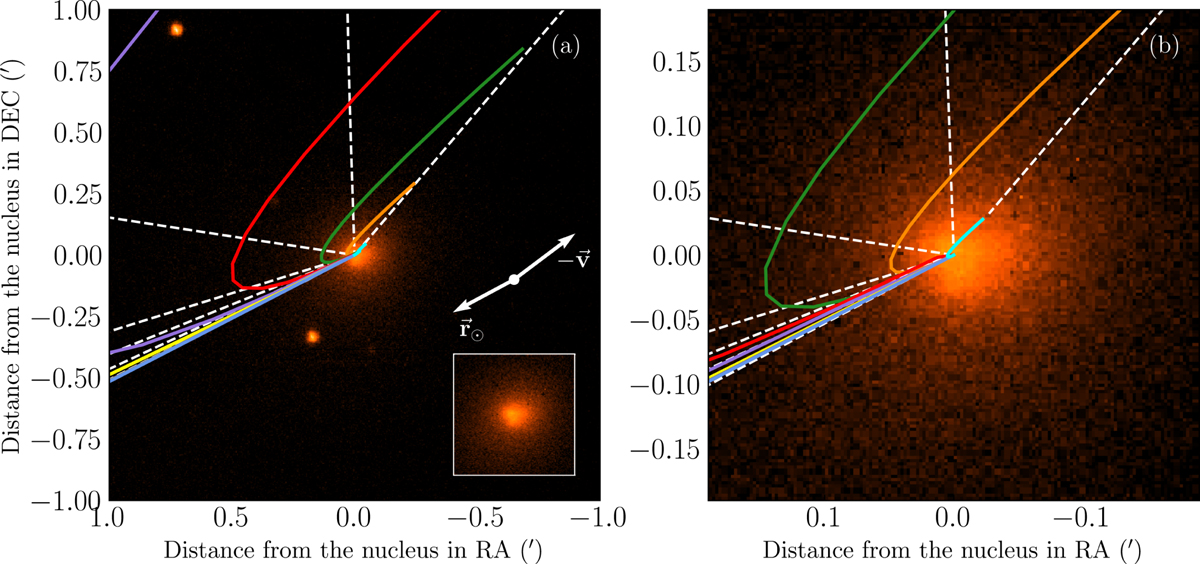
(a) Synchrones and syndynes of the T2 coma on UT 2021 June 26.2. The dashed lines are synchrones, indicating the locations of dust ejected at different times prior to the observation: 180, 120, 90, 60, 45, 30, 15, and 5 days from right to left. The solid curves are syndynes, where each has a constant β varying from 10−4 (low-mobility dust) to 1 (high-mobility dust) anticlockwise from the rightmost. A close-up image is given on the bottom right. (b) Same as T2 in panel a but with an image magnified five times.
Current usage metrics show cumulative count of Article Views (full-text article views including HTML views, PDF and ePub downloads, according to the available data) and Abstracts Views on Vision4Press platform.
Data correspond to usage on the plateform after 2015. The current usage metrics is available 48-96 hours after online publication and is updated daily on week days.
Initial download of the metrics may take a while.